
|
A step-by-step guide through all important features of the charts in the control.
|
 Run Run
|
|
|
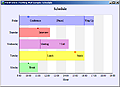
A sample bar chart that shows annotations at each bar to note the time of a certain event or appointment.
|
|
Run
|
|

|
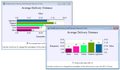
This sample demonstrates the core BarChart features. The orientation of the chart can be changed from vertical to horizontal.
|
|
Run
|
|

|
The sample demonstrates a 3D bar chart with a variety of controls that let you experiment with the chart settings.
|
|
Run
|
|
|
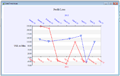
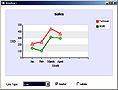
A line chart with two series - one bound to the X-axis and the other to the second X-axis. The data on both X-axis is DateTime values. The line series are drawn as dashed lines with scatters at data points. The chart shows both positive and negative values at the Y-axis.
|
|
Run
|
|
|
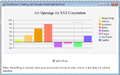
Bar chart with bars that show both positive and negative values and a legend. The check box under the chart lets you drag the bars to change their value.
|
|
Run
|
|
|
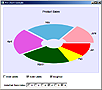
This sample demonstrates various PieChart features such as detached pieces, inner and outer labels, pie and doughnut chart.
|
|
Run
|
|

|
The sample demonstrates a 3D pie chart with a variety of controls that let you experiment with the chart settings.
|
|
Run
|
|
|
A LineChart with two series and a legend. Demonstrates the various line types. Supports labels at data points.
|
|
Run
|
|
|
A bar chart with top labels. The chart turns from vertical to horizontal with a mouse click. The verical chart has second Y-axis and custom labels at the X-axis. When the chart is horizontal the second X-axis is drawn and the custom labels are the at Y-axis.
|
|
Run
|
|

|
A bar chart that demonstrates legend and grid options. The legend can change position and alignment. The grid has customizable strokes, fills and type.
|
|
Run
|
|
|
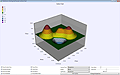
Demonstrates the 3D surface chart with options to change various appearance settings like color map, wire frame, camera type and perspective, elevation type and sensitivity and more.
|
|
Run
|
|
|
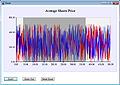
The sample demonstrates how to zoom a line chart. There are also buttons to zoom out the chart step by step or reset the chart to its original state with a single mouse click.
|
|
Run
|
|
|
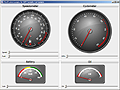
This sample illustrates a set of Oval gauge controls styled with custom templates in order to achieve the look of a car dashboard. In addition, the sample demonstrates how to embed gauges within each other.
|
|
Run
|
|

|
The implementation of a Clock control using an Oval gauge is demonstrated in this sample. The clock appearance is almost identical to the system clock in Windows Vista.
|
|
Run
|
|

|
Extensive use of styling and templating is illustrated in this example in order to skin an Oval gauge control as a compass widget.
|
|
Run
|
|

|
This sample illustrates the use of cutsom Styles applied to both Linear and Oval gauges to achieve a particular effect. In this case the controls are skinned to resemble an analog equalizer control set.
|
|
Run
|
|

|
This sample demonstrates different distribution of values along an oval scale. The sample demonstrates the linear and logarithmic built-in functions as well as a custom quadratic function.
|
|
Run
|
|

|
This sample demonstrates the predefined styles for quadratic oval gauges and how to use them directly in your application.
|
|
Run
|
|

|
This sample demonstrates the use of oval gauges in a PC resource monitor application.
|
|
Run
|
|

|
This sample demonstrates an out-of-the-box Oval gauge without any additional styles applied to it.
|
|
Run
|
|

|
The sample demonstrates a Linear gauge with a custom template applied to it. A custom-styled indicator with several states is embedded in the scale.
|
|
Run
|
|

