Post by Forum Admin on Jul 4th, 2017 at 11:49am
WebForms Pack 2017.R1 contains the following new features and improvements:
MindFusion.Diagramming
The list below describes recent changes and additions to MindFusion.Diagramming for WebForms:
Free-form nodes
A FreeFormNode collects all points from users' mouse or touch input and displays them as node's outline. To let users draw free-form nodes interactively, set Behavior to DrawFreeForms or LinkFreeForms. Use the Points property of FreeFormNode to get or set outline points programmatically. If the Closed property is set, the node is drawn as a closed shape and its interior filled, or otherwise the node is drawn as a poly-line. If the distance between first and last points drawn by user is shorter than AutoCloseDistance, the node's Closed property is automatically set to true. AutoCloseDistance default value is float.MaxValue, so free-form nodes are always closed.
Convert free-form drawings to ShapeNodes
Additional drawing modes, convenient for touch input, convert FreeFormNode objects drawn by user to ShapeNode objects with matching shapes. To enable them, set Behavior to DrawFreeShapes or LinkFreeShapes. The shapes against which the user's input is matched are set via diagram's FreeFormTargets property. By default it contains Rectangle, Decision and Ellipse shapes.
User-interaction controllers
All kinds of user interaction are now carried out by controller objects. The startDraw method of BehaviorBase-derived classes that returned an opaque InteractionState instance has been replaced by createController method returning a controller of class specific to the modified item and interaction types. Built-in controllers include CreateNodeController, CreateLinkController, ModifyNodeController, ModifyLinkController, LaneGridController. You can also create custom controllers by deriving and overriding the methods of SinglePointerController -
Code (]
SinglePointerController.prototype =
{
start: function (position) {},
move: function (position) {},
validate: function (position) {},
commit: function (position) {},
cancel: function (position) {},
drawInteraction: function (context) {}
}[/code):
where position in MindFusion.Drawing.Point instance specifying logical coordinates in the diagram (in current measure unit, not scaled by zoom factor). The results of called mouse methods will depend on diagram's current Behavior, e.g. you could assert that a sequence of down/move/up events creates a ShapeNode when Behavior is set to DrawShapes.
Create an instance of controller class and call its start, move and commit methods. This would not depend on the value of Diagram.Behavior, but could be still affected by other behavioral properties such as AllowSelfLoops and AllowUnconnectedLinks.
Check assertions after replaying a recording on a saved diagram.
Ruler control
The Ruler control provides horizontal and vertical scales that help users measure and align diagram items. In order to set up a Ruler instance, create a Ruler element and set its DiagramViewID property to the target DiagramView -
Code (aspx):
3rd party dependencies now optional
The diagram can now be used without JQuery and Microsoft Ajax libraries. To enable that mode, set ClientScriptMode="StandAlone" for DiagramView element. Stand-alone mode requires relatively modern browsers, the base feature-set against we test it is the one of IE11.
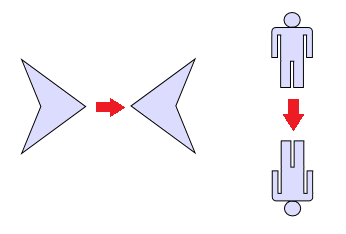
Flip shapes
The shape of a ShapeNode can be flipped horizontally or vertically. Enable the AllowFlip property and the shape flips when an edge is dragged over its opposite edge. You can get or set current flip state using FlipX and FlipY properties.
Revamped item dependency system
Dependencies between diagram items are now expressed by rule objects and applied in sequence by the DiagramMediator class. Built-in dependencies are implemented by ItemFollowsContainerRule, AttachedFollowsMasterRule, LinkFollowsNodesRule, NodeFollowsSelectionRule rules. You can create custom rule objects with following API and add them to DiagramMediator.AllRules array to make items follow other items during user interaction -
Code (]
var MyRule =
{
dependencies: function (master) {}, // return array of items that should follow master
dependentUpon: function (dependency) {}, // return array of items that should be followed by dependency
recognize: function (dependency) {}, // return true or false if this rule should be applied on an item
updateFromMasters: function (dependency, originalStates) // set new position or size of dependency
}[/code):
DiagramLink improvements
Canvas mode improvements
Miscellaneous
MindFusion.Charting
The list below describes recent changes and additions to MindFusion.Charting for WebForms:
Client side drawing
Charts are now rendered on client side using HTML5 Canvas API instead of generating bitmaps on server-side. This also enables user interaction: plots can now be scrolled or zoomed, legends can be moved around, colors can change in response to mouse events. In addition, you can load new data into the charts dynamically using client-side JavaScript API.
New data model
Data that should be drawn in charts is read through an interface called Series, whose instances can be assigned to the Series properties of Chart and SeriesRenderer classes. You could implement this interface in your own model classes to avoid duplicating data. Alternatively, if a model class is sealed but provides API to access its data, you could implement the interface in an adapter class. The library includes several pre-defined series classes that let you specify data via IList or array objects. For example, BarSeries lets you specify lists of values, inner labels and top labels, and PointSeries lets you specify data as a list of points. In addition, the DataBoundSeries implementation can be used to automatically read from a .NET data source. Instances of latter series type are automatically generated when chart's DataSource property is set.
New rendering model
Chart graphics are drawn inside Plot components by SeriesRenderer -derived objects. Each plot can contain multiple series renderers from same or different types. For example, you can draw area, line and bar graphics in same plot by adding AreaRenderer, LineRenderer and BarRenderer objects to its SeriesRenderers collection. Concrete Chart classes automatically generate a series renderer of appropriate type for their Series.
Dashboard
The Dashboard control can contain multiple plots, axes, legends, images, gauges and text blocks arranged in dynamic layout. Individual components can be added to dashboard's default RootPanel or LayoutPanel containers, or for more complex layouts add intermediary panels such as GridPanel and StackPanel to the default ones. To show different types of chart graphics, add Plot2D to draw in 2D Cartesian coordinate system, Plot3D for 3D Cartesian system, and PolarPlot for polar coordinate system. To draw horizontal or vertical axes, add respectively XAxisRenderer and YAxisRenderer objects.
Styling
Values of appearance properties can come from several places in the component hierarchy. SeriesRenderer -derived objects can use attributes from their local SeriesStyle, from plot's SeriesStyle, or from the *Series properties in current Theme. Component classes use either their local properties or ones defined in the theme. By default, appearance properties in SeriesRenderer and Component classes have null values, which makes the drawing code use values from the theme.
Funnel Chart
Funnel charts are often used to represent the stages of a process and show relative values or measurements associated with each stage. In MindFusion.Charting API, funnel charts can be created using the FunnelChart stand-alone control or a FunnelRenderer instance placed inside a more complex dashboard. FunnelChart inherits from the base Chart class and offers additional customization through its SegmentSpacing and StemWidth properties.
Interactive range selection
RangeSelector is a scrollbar-like component that lets users scroll or resize currently visible range of chart's data. BiaxialChart shows a horizontal range selector when its showXRangeSelector property is enabled, and a vertical one when ShowYRangeSelector is enabled. Scroll ranges are specified using XScrollRangeMin and XScrollRangeMax properties for the X axis, and YScrollRangeMin and YScrollRangeMax properties for Y axis.
Installer for the latest version can be downloaded here, or from the clients area on our site:
https://mindfusion.eu/WebFormsTrial.zip
Updated assemblies and script files are also available as MindFusion.Pack.WebForms NuGet package.
Enjoy!
MindFusion.Diagramming
The list below describes recent changes and additions to MindFusion.Diagramming for WebForms:
Free-form nodes
A FreeFormNode collects all points from users' mouse or touch input and displays them as node's outline. To let users draw free-form nodes interactively, set Behavior to DrawFreeForms or LinkFreeForms. Use the Points property of FreeFormNode to get or set outline points programmatically. If the Closed property is set, the node is drawn as a closed shape and its interior filled, or otherwise the node is drawn as a poly-line. If the distance between first and last points drawn by user is shorter than AutoCloseDistance, the node's Closed property is automatically set to true. AutoCloseDistance default value is float.MaxValue, so free-form nodes are always closed.
Convert free-form drawings to ShapeNodes
Additional drawing modes, convenient for touch input, convert FreeFormNode objects drawn by user to ShapeNode objects with matching shapes. To enable them, set Behavior to DrawFreeShapes or LinkFreeShapes. The shapes against which the user's input is matched are set via diagram's FreeFormTargets property. By default it contains Rectangle, Decision and Ellipse shapes.

User-interaction controllers
All kinds of user interaction are now carried out by controller objects. The startDraw method of BehaviorBase-derived classes that returned an opaque InteractionState instance has been replaced by createController method returning a controller of class specific to the modified item and interaction types. Built-in controllers include CreateNodeController, CreateLinkController, ModifyNodeController, ModifyLinkController, LaneGridController. You can also create custom controllers by deriving and overriding the methods of SinglePointerController -
Code (]
SinglePointerController.prototype =
{
start: function (position) {},
move: function (position) {},
validate: function (position) {},
commit: function (position) {},
cancel: function (position) {},
drawInteraction: function (context) {}
}[/code):
|
where position in MindFusion.Drawing.Point instance specifying logical coordinates in the diagram (in current measure unit, not scaled by zoom factor). The results of called mouse methods will depend on diagram's current Behavior, e.g. you could assert that a sequence of down/move/up events creates a ShapeNode when Behavior is set to DrawShapes.
Ruler control
The Ruler control provides horizontal and vertical scales that help users measure and align diagram items. In order to set up a Ruler instance, create a Ruler element and set its DiagramViewID property to the target DiagramView -
Code (aspx):
|
3rd party dependencies now optional
The diagram can now be used without JQuery and Microsoft Ajax libraries. To enable that mode, set ClientScriptMode="StandAlone" for DiagramView element. Stand-alone mode requires relatively modern browsers, the base feature-set against we test it is the one of IE11.
Flip shapes
The shape of a ShapeNode can be flipped horizontally or vertically. Enable the AllowFlip property and the shape flips when an edge is dragged over its opposite edge. You can get or set current flip state using FlipX and FlipY properties.
Revamped item dependency system
Dependencies between diagram items are now expressed by rule objects and applied in sequence by the DiagramMediator class. Built-in dependencies are implemented by ItemFollowsContainerRule, AttachedFollowsMasterRule, LinkFollowsNodesRule, NodeFollowsSelectionRule rules. You can create custom rule objects with following API and add them to DiagramMediator.AllRules array to make items follow other items during user interaction -
Code (]
var MyRule =
{
dependencies: function (master) {}, // return array of items that should follow master
dependentUpon: function (dependency) {}, // return array of items that should be followed by dependency
recognize: function (dependency) {}, // return true or false if this rule should be applied on an item
updateFromMasters: function (dependency, originalStates) // set new position or size of dependency
}[/code):
|
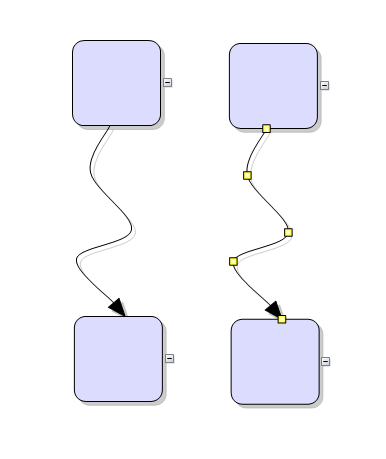
DiagramLink improvements
- the component no longer keeps a separate segmentCount field, removing a common source of errors. The SegmentCount property now calculates its value from ControlPoints elements. The UpdateFromPoints(updateGroups, updateSegments) overload has been removed too;
- SegmentCount setter no longer refuses changing number of segments if auto-routing is enabled or the link is a self-loop;
- the new Spline element of LinkShape enumeration draws links as interpolating splines that pass through all of their control points:
Canvas mode improvements
- DiagramLink.HeadPen property now works in Canvas mode. Its corresponding methods in JavaScript API are setHeadStroke, setHeadStrokeThickness and setHeadStrokeDashStyle;
- CaptionFormat properties of TableNode and ContainerNode are now supported in Canvas mode. Corresponding methods in JavaScript API are setTextAlignment and setLineAlignment;
- the AllowResizeHeaders property of swimlanes Grid now supported in Canvas mode. The control raises HeaderStartResizingScript validation event when the user tries to resize, and HeaderResizedScript when the operation completes.
- NodeSize and DefaultNodeSize properties of NodeListView can be set to SizeF.Empty, in which case the control will use the sizes stored in node.Bounds;
- the control now supports cyclic attachment created using DiagramNode.attachTo method, where moving any of the attached nodes will move all other nodes in the cycle;
- Shapes.RoundRect corner arcs keep constant radius and no longer deform when the node size changes to non-rectangular;
- ItemAddedScript and ItemRemovedScript events raised when an item is added or removed, either from code or interactively;
- DiagramView.CustomLinkType property now supported in Canvas mode;
- Diagram.AllowSelfLoops property now supported in Canvas mode;
Miscellaneous
- CaptionBackBrush and FoldIconSize properties added to ContainerNode.
- Multiple rotation of nodes improved, now node angles are modified by same rotation delta calculated from mouse position instead of pointing all rotation handles in mouse direction.
- CustomLinkType property now supported in Canvas mode.
- The LinkPadding property of LayeredLayout specifies the padding space between Cascading links.
- Export overloads that write to Stream objects added to PdfExporter, VisioExporter and Visio2013Exporter.
- ClientScriptMode="JQuery" now supports version 3 of JQuery.
- NodePastedScript and LinkPastedScript client-side events raised when items are pasted from the clipboard.
- PdfExporter now creates page hyperlinks if HyperLink is set to a value in "page://{number}" format, e.g. set "page://1" to open the second PDF page when the item is clicked.
- TypeScript definitions for the client-side Diagramming API are now provided in jsdiag.d.ts file.
MindFusion.Charting
The list below describes recent changes and additions to MindFusion.Charting for WebForms:
Client side drawing
Charts are now rendered on client side using HTML5 Canvas API instead of generating bitmaps on server-side. This also enables user interaction: plots can now be scrolled or zoomed, legends can be moved around, colors can change in response to mouse events. In addition, you can load new data into the charts dynamically using client-side JavaScript API.
New data model
Data that should be drawn in charts is read through an interface called Series, whose instances can be assigned to the Series properties of Chart and SeriesRenderer classes. You could implement this interface in your own model classes to avoid duplicating data. Alternatively, if a model class is sealed but provides API to access its data, you could implement the interface in an adapter class. The library includes several pre-defined series classes that let you specify data via IList or array objects. For example, BarSeries lets you specify lists of values, inner labels and top labels, and PointSeries lets you specify data as a list of points. In addition, the DataBoundSeries implementation can be used to automatically read from a .NET data source. Instances of latter series type are automatically generated when chart's DataSource property is set.
New rendering model
Chart graphics are drawn inside Plot components by SeriesRenderer -derived objects. Each plot can contain multiple series renderers from same or different types. For example, you can draw area, line and bar graphics in same plot by adding AreaRenderer, LineRenderer and BarRenderer objects to its SeriesRenderers collection. Concrete Chart classes automatically generate a series renderer of appropriate type for their Series.
Dashboard
The Dashboard control can contain multiple plots, axes, legends, images, gauges and text blocks arranged in dynamic layout. Individual components can be added to dashboard's default RootPanel or LayoutPanel containers, or for more complex layouts add intermediary panels such as GridPanel and StackPanel to the default ones. To show different types of chart graphics, add Plot2D to draw in 2D Cartesian coordinate system, Plot3D for 3D Cartesian system, and PolarPlot for polar coordinate system. To draw horizontal or vertical axes, add respectively XAxisRenderer and YAxisRenderer objects.
Styling
Values of appearance properties can come from several places in the component hierarchy. SeriesRenderer -derived objects can use attributes from their local SeriesStyle, from plot's SeriesStyle, or from the *Series properties in current Theme. Component classes use either their local properties or ones defined in the theme. By default, appearance properties in SeriesRenderer and Component classes have null values, which makes the drawing code use values from the theme.
Funnel Chart
Funnel charts are often used to represent the stages of a process and show relative values or measurements associated with each stage. In MindFusion.Charting API, funnel charts can be created using the FunnelChart stand-alone control or a FunnelRenderer instance placed inside a more complex dashboard. FunnelChart inherits from the base Chart class and offers additional customization through its SegmentSpacing and StemWidth properties.
Interactive range selection
RangeSelector is a scrollbar-like component that lets users scroll or resize currently visible range of chart's data. BiaxialChart shows a horizontal range selector when its showXRangeSelector property is enabled, and a vertical one when ShowYRangeSelector is enabled. Scroll ranges are specified using XScrollRangeMin and XScrollRangeMax properties for the X axis, and YScrollRangeMin and YScrollRangeMax properties for Y axis.

Installer for the latest version can be downloaded here, or from the clients area on our site:
https://mindfusion.eu/WebFormsTrial.zip
Updated assemblies and script files are also available as MindFusion.Pack.WebForms NuGet package.
Enjoy!