
The list below describes recent changes and additions to MindFusion.Charting for WPF:
Support for Multiple Axes
The chart can now render multiple axes at each side of the plot area. To enable that, add a new Axis instance to the XAxes collection properties for bottom axes, to YAxes collection for left-hand axes, and X2Axes / Y2Axes for respectively top and right sides. The old AxisSettings class and XAxisSettings / YAxisSettings objects have been removed, and now their properties are set independently for each Axis instance in the collections.
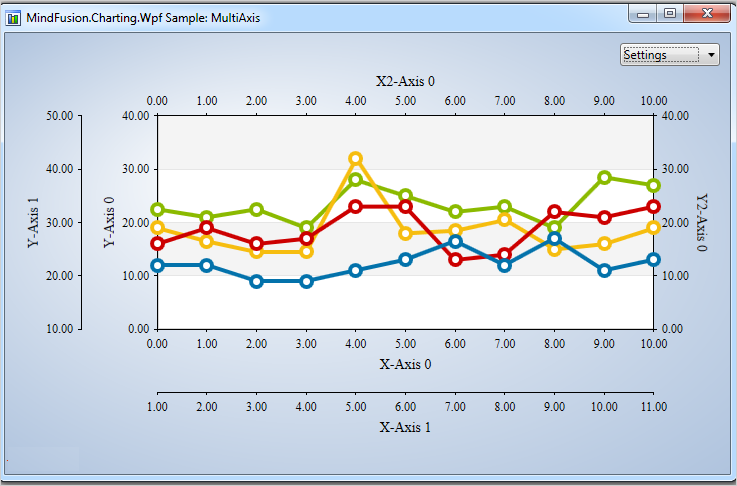
Multiple axes in the WPF chart control.
Improved Zooming
Selected area with width smaller than MinZoomSpan does not evoke any action in the control. In addition, the new ZoomChanged event fires whenever zoom occurs and provides useful data for the zoom action with its ZoomChangedArgs.
Cross Hair Improvements
The cross hair control has been improved with several new properties, a method and an event. The properties are:
- CrossHairBackground, which lets you change the background of the control.
- CrossHairTemplate, which you can use to set your own ControlTemplate for the cross hair.
- CrossHairType that let you choose among several types of cross hair to display.
The new CrossHairPosition method returns the current location of the cross hair. For more precise handling of cross hair movements a new event is available – CrossHairPositionChanged.
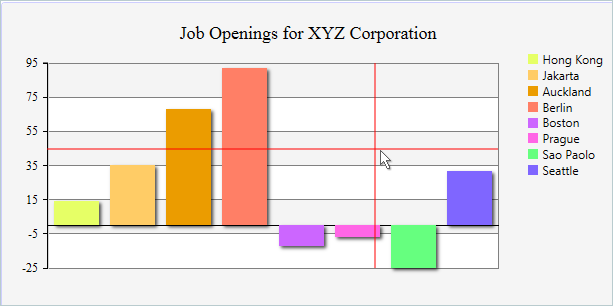
Cross hair is drawn in a WPF column chart.
Greatly Improved 3D Charts
3D charts have received plenty of improvements, new properties and performance optimizations: PointMergeThreshold – The property sets the radius of an area around a given point where no other points are drawn. The result is better performance especially in charts with numerous points, which happen to be close to one another. Of points with similar coordinates only a single one is rendered, the rest are omitted.
InterpolationType.None – A new InterpolationType has been added to the InterpolationType enum, which does not interpolate but adds data directly and connects the points with triangulation.
The SurfaceType enum has been replaced with three bool properties, which makes the API easier to understand and use.
- ShowSurface – shows/hides the surface of a 3D chart
- ShowScatters – shows/hides the scatters
- ShowWireFrame – shows/hides the wireframe
ScatterFaceSize – the property regulates the size of the polygons that build a 3D scatter. Bigger values lead to bigger polygons, which results in faster performance and rougher scatter mesh. Effect3D.ShaderEffect – the property can be applied to all 3D chart elements, including scatters and performs much faster.
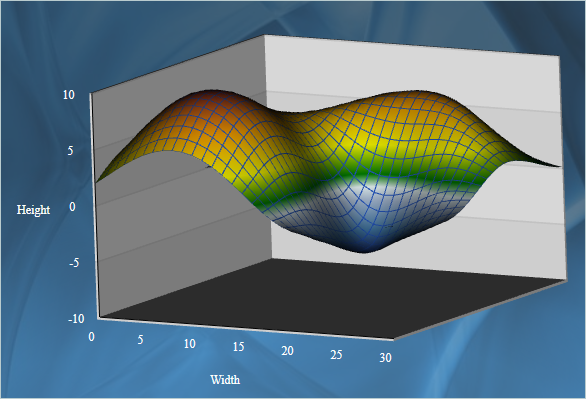
3D surface chart with color map and wire frame.
Exporting Images
Two new methods have been added for exporting the chart as an image – CreateImage and ExportImage.
Custom Formatting of Labels in Real-time Charts
A new property has been added to the RealTimeChart library – Axis.LabelFormatProvider. Use it to specify custom formatting of numeric labels. If required, you can specify format arguments for your format classes with Axis.LabelFormat.
Direct download of the trial version is available from here:
Download MindFusion.Charting for WPF 2.0 Trial Version
You are welcome to contact us with any questions, problems or inquiries about the Charting for Wpf control or any other of our products. MindFusion has always put special emphasis on providing excellent customer support and we usually answer your inquiries in a few hours of receiving them.
About MindFusion.Charting for Wpf: A programming component that combines powerful charting capabilities with an elegant API and easy use. Among the features of the control are fully customizable grid, positive and negative values on all chart axes, 3D charts, gauges and many more – read a detailed list here.
The control provides detailed documentation and various samples that demonstrate how to customize every type of chart. It supports a wide range of 2D and 3D charts including bar, line, radar, bubble pie etc. You can add tooltips, define themes, perform hit testing, zoom and more.