|
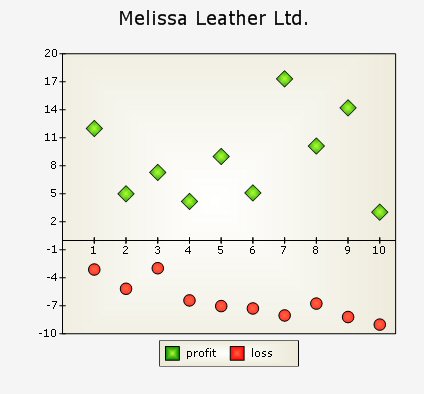
Scatter chart with two series and different scatter shapes. The X - axis shows the chart data. Y - axis shows the numerical auto scale. The plot area has a background and an outlining.
The legend is centered at the bottom of the chart. It is drawn in one row and with an outlining.
|