


I. Charts that use the Cartesian coordinate system - bar, line, area etc.
The XAxisSettings, YAxisSettings, Y2AxisSettings and X2AxisSettings are used for setting the properties of the axes. The labels at each axis depend on the AxisSettings.LabelType property. If the AxisSettings.LabelType is LabelType.CustomText there are two options for placing custom labels:
- at scale divisions - the AxisSettings.CustomLabelPosition property should be set to CustomLabelPosition.AutoScalePoints
- at the position of data points - the AxisSettings.CustomLabelPosition property should be set to CustomLabelPosition.ChartDataPoints
The Title property sets the title of the axis. The title is drawn behind the labels. The space between the title and the labels is set with AxisSettings.TitleOffset.
Custom labels for the X, Y, Y2 or X2 axis are specified with the AxesChart.XLabels, AxesChart.YLabels, AxesChart.Y2Labels or AxesChart.X2Labels properties. Of course, you can use data binding - specify the name of the data bound property with AxesChart.XLabelPath, AxesChart.YLabelPath, AxesChart.Y2LabelPath and AxesChart.X2LabelPath.
The sample code demonstrates how to set t title, the label type and the position of the custom labels as well the labels using a data bound property:
C#
 Copy Code Copy Code
|
|---|
barChart1.DataSource = sales; |
| VB.NET
Copy Code
|
|---|
barChart1.DataSource = sales |
II. Polar and Radar charts
Radar and polar charts have two types of axes: inner and outer. The following illustration identifies them:
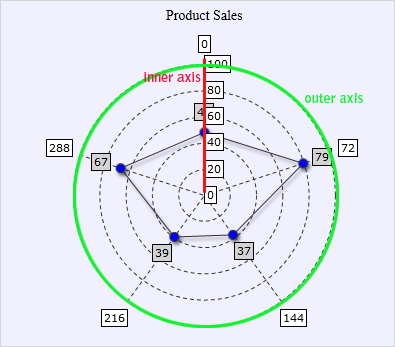
The inner axis can start from any position - use StartAngle to set where it will be drawn. It can have any type of labels supported by the LabelType enumeration - use InnerLabelType to specify it. The axis is drawn with InnerAxisStroke. You can use InnerStrokeThickness and InnerStrokeDashArray to customize its appearance.
The outer axis is drawn with OuterAxisStroke. It can be customized with OuterStrokeDashArray and OuterStrokeThickness. The labels for it are set with OuterLabelType. Use OuterLabelType to set the type of the labels that will be drawn at the axis.