MindFusion.Charting for Silverlight allows users to change data of a bar in a bar chart or the coordinates of a point in a line chart. This is done by setting the AxesChart.Behavior property to Behavior.AllowXDrag or Behavior.AllowYDrag. The Behavior enumeration allows bitwise combining of its members.
- If you want to allow dragging the data point in any direction you should use:
C#
 Copy Code Copy Code
|
|---|
lineChart1.Behavior = Behavior.AllowXDrag | Behavior.AllowYDrag; |
| VB.NET
Copy Code
|
|---|
lineChart1.Behavior = Behavior.AllowXDrag Or Behavior.AllowYDrag |
In bar charts you should only allow dragging in the direction of the bar - for horizontal bars this is Behavior.AllowXDrag, for vertical it is Behavior.AllowYDrag.
- If you want to stop the drag behavior you should set the property to Behavior.DoNothing:
| C#
Copy Code
|
|---|
lineChart1.Behavior = Behavior.DoNothing; |
| VB.NET
Copy Code
|
|---|
lineChart1.Behavior = Behavior.DoNothing |
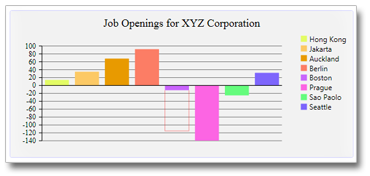
- When the chart is dragged a thin red line appears to indicate the contour of the resulting graphic. If the graphic is dragged beyond values currently visible at the axes, the axes is rescaled automatically.