


There are no limits as to the count of legend you can add to the chart. They must be added to the Chart.Legends property. MindFusion.Gauges for Silverlight supports two types of legends.
Chart Legend
ChartLegend takes its labels from the ChartSeries.Title property of the ChartSeriesCollection it refers to. Use ChartLegend.Series to set the ChartSeriesCollection. The brushes for the rectangles that are drawn before each label are taken automatically from ChartSeries.Fills. If a given ChartSeries has more than brushes in its Fills property, the first brush is taken.
Here is a sample code that creates a ChartLegend that is bound to the Series collection of the chart.
C#
 Copy Code Copy Code
|
|---|
ChartLegend legend = new ChartLegend(); |
| VB.NET
Copy Code
|
|---|
Dim legend As New ChartLegend() |
Series Legend
SeriesLegend is designed to give details about data in a single ChartSeries. Its labels and brushes are custom-set with the SeriesLegend.LabelsSource and SeriesLegend.BrushesSource properties.
Here is a sample code that creates a SeriesLegend with two brushes and two labels:
| C#
Copy Code
|
|---|
SeriesLegend legend1 = new SeriesLegend(); |
| VB.NET
Copy Code
|
|---|
Dim legend1 As New SeriesLegend() |
Customizing the Legend's Appearance
The following properties are used to customize how the legend looks:
- Orientation for specifying whether labels are drawn in a row or column
- CornerRadius for rounding the edges of the legend's rectangle.
- Background and BorderBrush
Position of the Legend
You can place the legend anywhere around the plot area where the chart is drawn. The docking of the legend is set with the Dock attached property of the LayoutPanel, which contains both the chart and the legend. The alignment of the legend depends on its position: if its docked to the bottom or the top of the plot area, the alignment is set with the HorizontalAlignment. If the legend is placed at the left or right side of the plot area, its alignment is set with VerticalAlignment.
Here is sample code that palces a legend to the right of the plot area and algns it in the middle:
| C#
Copy Code
|
|---|
LayoutPanel.SetDock(legend, Dock.Right); |
| VB.NET
Copy Code
|
|---|
LayoutPanel.SetDock(legend, Dock.Right) |
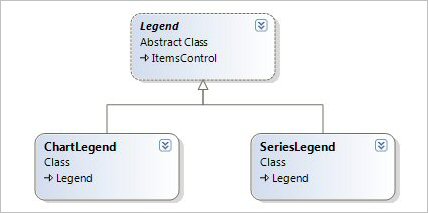
A diagram of the legend classes.