


With MindFusion.Charting for Silverlight you can:
- Create custom themes based on the appearance of an existing chart;
- Save a custom theme as an XML file;
- Load a custom theme from its XML file;
- Use a number of predefined themes.
I. Create a custom theme based on the appearance of an existing chart.
1. Style your chart as you want. In our sample we will use a BarChart. We set a background, font settings for the title, brushes for the grid and customize the outline of the chart:
C#
 Copy Code Copy Code
|
|---|
BarChart modelChart = new BarChart() |
| VB.NET
Copy Code
|
|---|
Dim modelChart As New BarChart() With { _ |
2. Next, we set the colors for the bars in a BarSeries. We add the series to the chart:
| C#
Copy Code
|
|---|
BarSeries series = new BarSeries() modelChart.Series.Add(series); |
| VB.NET
Copy Code
|
|---|
Dim series As New BarSeries() With { _ modelChart.Series.Add(series) |
3. We finally create a new ChartTheme based on the model and we apply this theme to the chart we already have - barChart1.
| C#
Copy Code
|
|---|
//create the theme //apply the theme |
| VB.NET
Copy Code
|
|---|
'create the theme 'apply the theme |
II. Save a custom theme as a XML file.
In the installation folder of the component you will find the ThemeEditor tool. Use it to create, edit, load and save ChartTheme-s on your computer. There is a shortcut to the ThemeEditor from the MindFusion.Charting for Silverlight items group in your start menu.
III. Load a theme from a XML file.
Add the XML file to your Silverlight project and set it its BuildAction to "Resource".  Important!
Use the following code to load and apply the ChartTheme. Here we load the theme Green.xml and apply it to out chart called barChart1:
| C#
Copy Code
|
|---|
StreamResourceInfo stream = Application.GetResourceStream( ChartTheme theme = new ChartTheme(); |
| VB.NET
Copy Code
|
|---|
Dim stream As StreamResourceInfo = Application.GetResourceStream(New Uri("SilverlightApplication1;component/Resources/Green.xml", UriKind.Relative)) Dim theme As New ChartTheme() |
IV. Predefined themes.
MindFusion.Charting for Silverlight offers a set of predefined themes, which are found in the setup directory. You can load them the way you would load any XML ChartTheme - see point III.
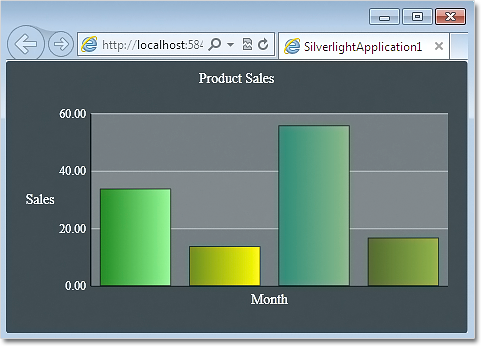
The predefined Green theme applied on a bar chart.