


MindFusion.Charting supports DateTime values as data for all its chart types. You can add the DateTime values the same way as you add numbers. You can also use any other data, for example, strings as long as it can be parsed to valid DateTime values.
Data cannot be mixed - for any of the XData, YData or Y2Data properties, you can use either numbers or DateTime values.
Labels at the axis are drawn as DateTime values if you set the DateTimeFormat property to any of the date / time formats - ShortDate, LongDate and so on.
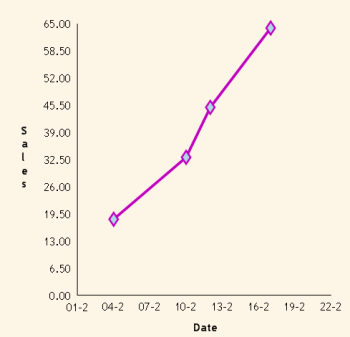
The following sample creates a line chart with 4 DateTime points.
- Add 4 DateTime values to the XData list
VB
 Copy Code Copy Code
|
|---|
'Create the DateTime data |
- Set XAxisSettings.StartDateTime to Fabruary, 1st 2008
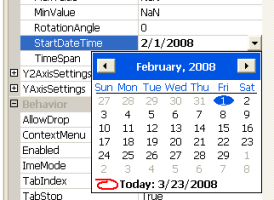
- Set the YAxisSettings.EndDateTime property to February, 20th 2008
| VB
Copy Code
|
|---|
Me.LineChart1.XAxisSettings.EndDateTime = New Date(2008, 2, 20, 0, 0, 0, 0) |
- Set the XAxisSettings.TimeSpan to 3 days
| VB
Copy Code
|
|---|
Me.LineChart1.XAxisSettings.TimeSpan = System.TimeSpan.Parse("3.00:00:00") |
- Set the format of data for the X-axis to CustomDateTime and set the DateTimeFormat
| VB
Copy Code
|
|---|
Me.LineChart1.XAxisSettings.DataFormat = MindFusion.Charting.DataFormat.CustomDateTime |
- Use the ChartPens, ShapePens and ShapeSizes properties to adjust the colors for the pen and the size of the shapes
- Set the BackgroundBrush
Here is the final chart:
See Also
DataFormat EnumerationDateTimeFormat Enumeration
NumberFormat Enumeration