


Create Chart in Web App Project
The chart component supports only WebAssembly render mode at this time, but you can also use it from “Blazor Web App” projects:
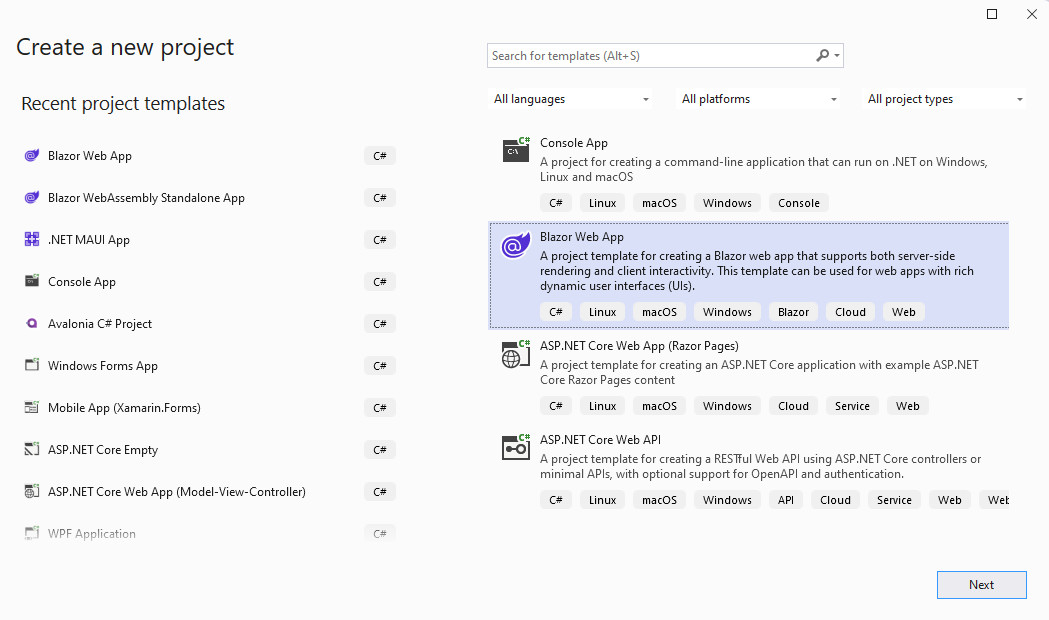
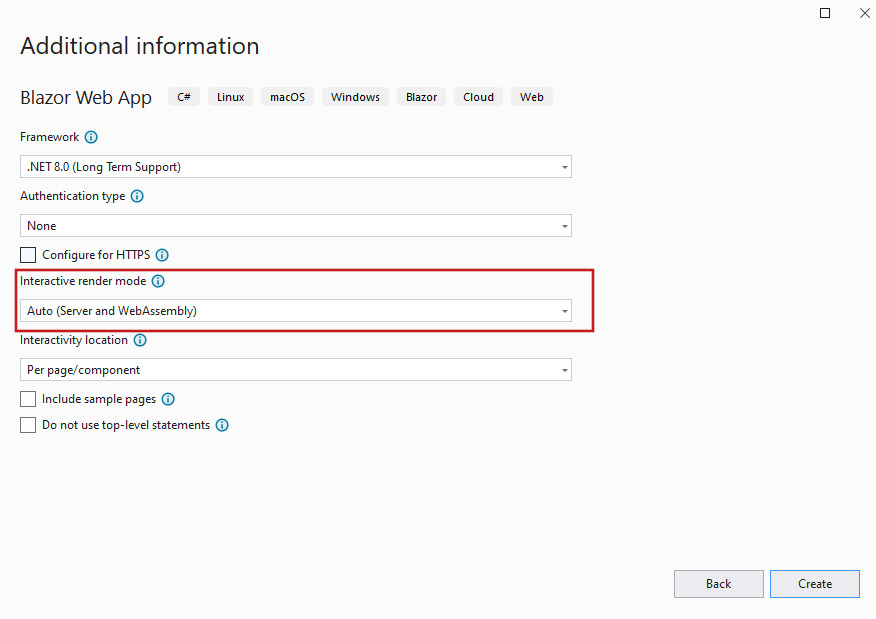
as long as you set the “Interactive render mode” option to WebAssembly or Auto (Server and WebAssembly):
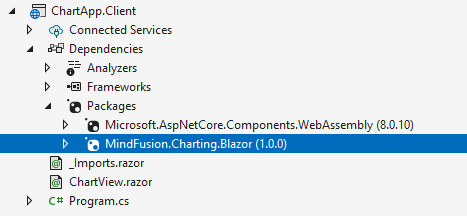
Then you can proceed and install the Charting library from NuGet as explained earlier. Note: You need to add the Blazor Charting package only to the .Client project:
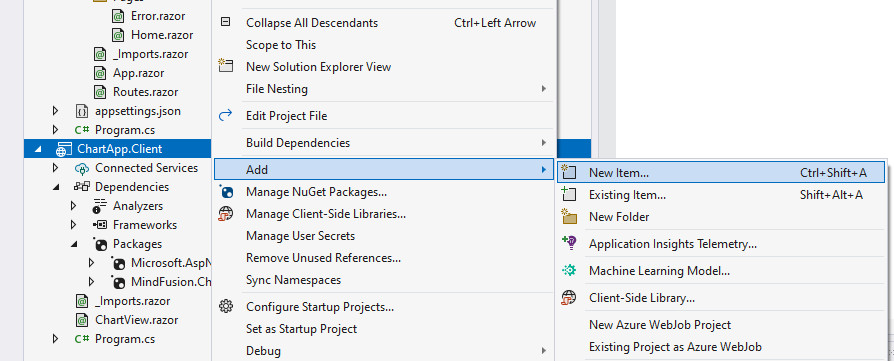
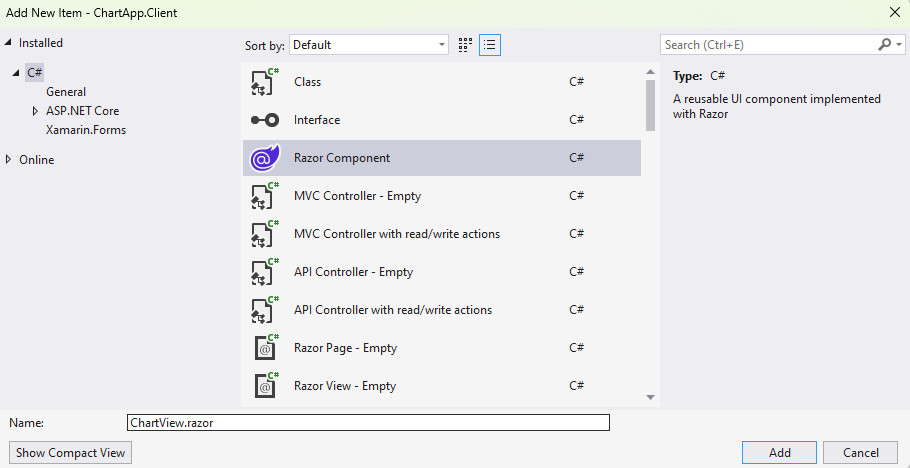
Once the package is installed, proceed with adding a new Razor component to the .Client project:
On the first line of the newly created Razor file, declare WebAssembly render mode by adding the @rendermode InteractiveWebAssembly directive:
C#
 Copy Code Copy Code
|
|---|
@rendermode InteractiveWebAssembly |
Then you can proceed with the import of the system and charting namespaces that you are going to use:
| C#
Copy Code
|
|---|
@using System.Reflection |
Now create the chart instance:
| C#
Copy Code
|
|---|
<div class="content"> |
The initialization of the chart variable and some necessary settings for the data are done in code, using the OnAfterRender method orverride:
| C#
Copy Code
|
|---|
@code { |
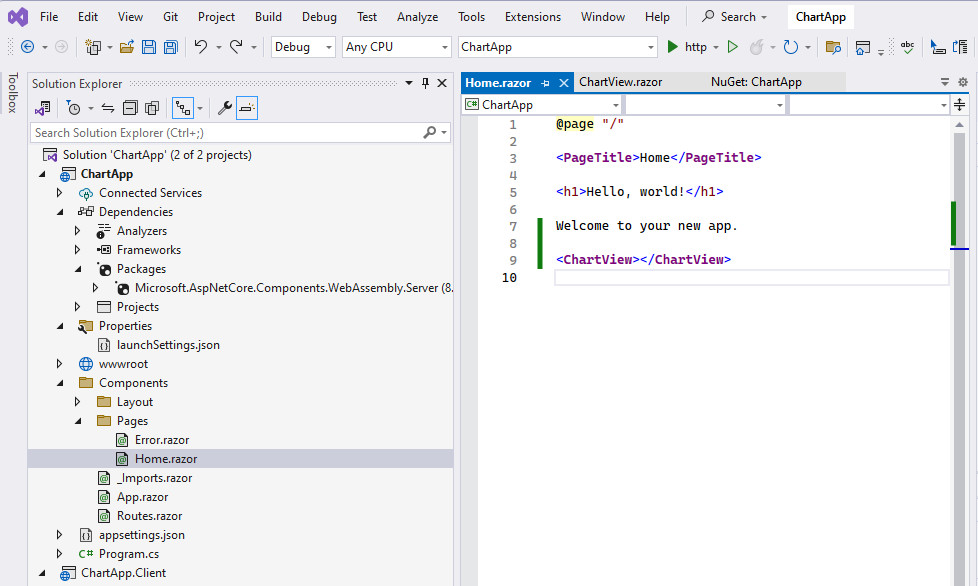
You can now add the razor chart view, which renders a Chart component, to a page rendered by the server. Open the Home.razor file from the server project and add the newly created component, in our sample it is called ChartView:
Browse the other sections of this help file to learn more about the functionality provided by the MindFusion.Charting classes, methods and properties. Follow the tutorials to learn how to load data into charts and create more complex plots. You could also peruse example projects provided under Samples subfolder of library's distribution.


