What's New in this Release
The list below describes recent changes and additions to MindFusion.Charting:
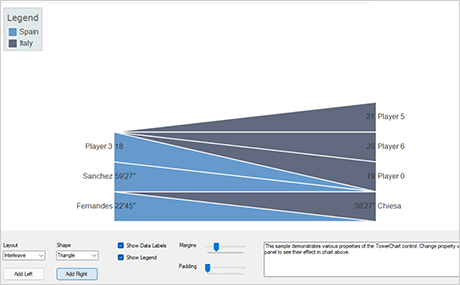
The TowerChart control and TowerRenderer component draw tower charts, rendering series side by side to allow comparing data sequence and sizes. Assign the series to compare to LeftSeries and RightSeries properties of the chart. The chart segments are arranged according to the value of TowerLayout property, and their shape is drawn as specified by SegmentShape.
Tower charts require three-dimensional series. The first dimension specifies event order or timing and is used to sort or position segments. Second dimension specifies duration and is rendered as segment length along the main axis. Third dimension specifies a value rendered as segment width along the cross axis. You could use the stock EventSeries class as data container, or implement the Series interface to provide data from your own data structures.