The list below describes past changes and additions to MindFusion.Charting for JavaScript:
New in version 1.2
Axis origin
The origin property of the Axis class lets you specify the origin of an axis. If set to a non-null value, the component renders an axis line inside the plot. Bars are drawn below that axis line if their values are smaller than the origin. For stacked bar charts, each bar length corresponds to the difference between bar's value and origin.
The Plot.drawOrigins and Plot2D.drawOrigins methods allow you to draw the axis origin lines when rendering the chart plot by yourself.

Miscellaneous
- A new SimpleSeries constructor override allows you to specify a list with tooltips for the newly created Series.
- The new drawLeftFromPoint method allows you to render text, which is left-aligned compared to a given Point.
- The new methods fromObject and toObject of the Font class allow you to deserialize and serialize Font instances from/to Json objects.
- innerLabelRotation, outerLabelRotation and stackOuterLabels properties give you better control over the rendering of labels in bar charts
- All Series can accept now simple JavaScript array-s as arguments instead of Collections.List instances
- The ToolTip class is greatly extended with many new properties that allow you to customize the apparance and position of tooltips
- The Color.knownColors field lists all standard CSS color names
- Brush and Pen instances can be created with simple strings that specify the HTML code of the color as argument instead of Color objects.
- The yLabelAlignment property of BiaxialChart specifies horizontal alignment of Y-axis labels.
- Texts are now properly underlined when FontStyle.Underline is set.
- Fixed a bug that caused a stacked BarChart sometimes to crash.
New in version 1.1.1
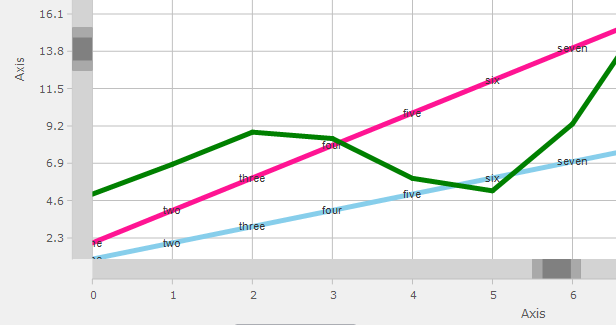
Interactive range selection
Miscellaneous
- Legends can display all elements of a series instead of series title values, which is useful for pie and funnel charts. To enable that mode, set the showSeriesElements of LegendRenderer to true, and assign the kind of labels to display to the elementLabelKind property.
- FunnelRenderer/FunnelChart bottomWidth property has been renamed to stemWidth.
- Event listeners' signatures used by IEventDispatcher implementations now include a sender argument.
- showHighlight and showToolTips properties let you disable highlights and tooltips.
New in version 1.1
FunnelChart
Funnel charts represent the stages of a process and show relative values or measurements associated with each stage. In MindFusion.Charting for JavaScript funnel charts can be created by utilizing the FunnelChart or FunnelRenderer classes. FunnelChart inherits from the base Chart class and offers additional customization through its segmentSpacing and stemBase properties.

Theme XML serialization
Themes now can be serialized to and from XML through the use of the respective loadFrom and saveTo methods.
Miscellaneous


