


Create Chart Instance
1. After running the chart's installer or adding its nuget package, you should see the controls from the library in Visual Studio toolbox:
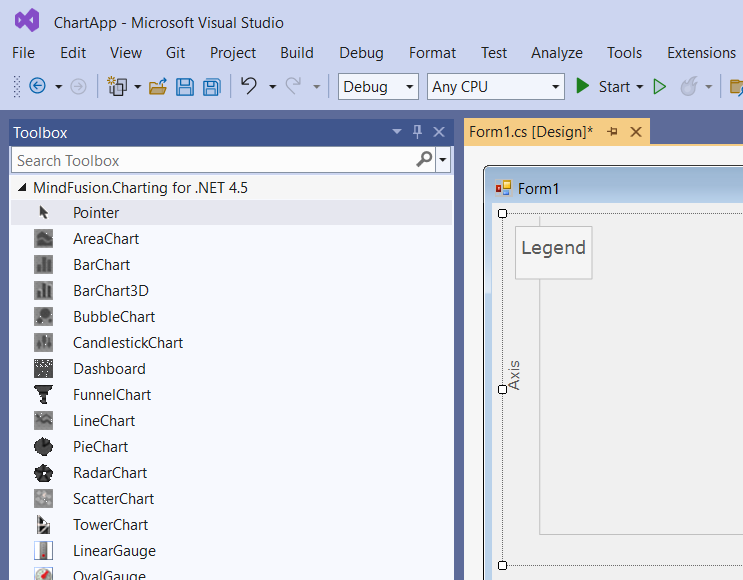
2. Drag a Dashboard ot Chart -derived control from the toolbox to the form. Dashboard lets you display mutiple plots, axes and gauges in dynamic layout. Chart controls display a single plot and type of graphics by default, but new ones can be added to them as well.
3. Expand References in Solution Explorer and confirm MindFusion.Charting.dll, MindFusion.Charting.WinForms.dll, MindFusion.Common.dll and MindFusion.Licensing.dll are listed. If only the WinForms.dll is listed, you must add references to the other assemblies manually. To do that, select Add Project Reference from project's context menu, open Browse tab, and navigate to either DotNet4 or DotNet8 folder. From the folder select the missing assemblies and click ok.
4. Instead of adding a toolbox control, you could create chart instance from code-behind:
C#
 Copy Code Copy Code
|
|---|
using MindFusion.Charting.WinForms; |
5. After you create a chart, you can add data to its Series collection. Double click the form to show its Load event handler. In the handler add data series using either ones of the pre-defined series classes (such as SimpleSeries, Series2D, XmlSeries, DataBoundSeries) or by implementing the Series interface in your own model class.
| C#
Copy Code
|
|---|
barChart.Series = new ObservableCollection<Series> |
6. Browse the other sections of this help file to learn more about the functionality provided by the MindFusion.Charting classes, methods and properties. Follow the tutorials to learn how to load data into charts and create more complex plots. You could also peruse example projects provided under Samples subfolder of library's distribution.


