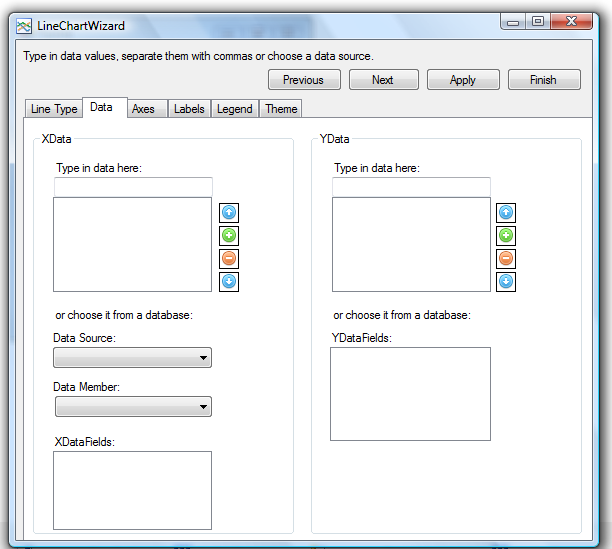
The Data tab has two group boxes that hold controls for setting the values for the X and Y data of the chart. Each group box has:
- A text box, where you can type-in the values, separate them with commas. Press ‘Enter’ when done. Use the buttons to the right to edit, remove, add or reorder the series
- If you want to use data from a database choose ‘<New>’ from the Data Source combo box. Follow the steps of the ‘Database connection wizard’. The newly added data sources are visible in the Data Sources list. Choose a ‘Data Set’ object and the tables will be added to the list of the Data Member combo box. After you select the table, the fields in it are shown in the XDataFields / YDataFields check list boxes. Select those that you want to use as XData / YData.