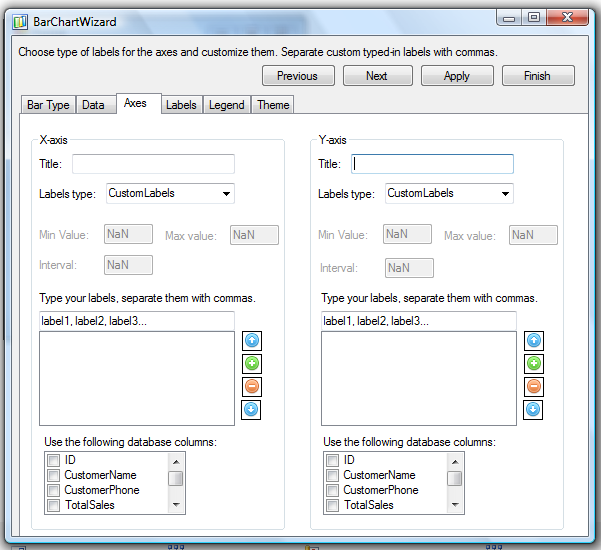
The axes tab lets you customize the appearance of the X and Y axis. It holds two groups of properties for each of the axis. Each group has:
- Title text box, where you write the title label for the axis.
- A combo box where you can choose the type of the labels that are drawn. The different label types enable different controls for further adjustment of the settings.
- Min Value and Max Value let you specify the first and last value at the axes. Interval specifies the value of the intervals with which the axes is divided. They are enabled only for AxisLabelType.AutoScale.
- If you want to draw custom labels, (AxisLabelType.CustomLabels) you can write them manually in the text box. Separate them with commas, press ‘Enter’ when done. You can delete, edit and reorder the label series with the buttons to the right of the list box.
If you have created a database connection, the database fields will be visible in the check list box at the bottom of the group panel. Check those that you want to serve as data for the labels – no need to choose only text (string) columns. If you haven’t set a database connection but want to use database columns for the labels, go to the ‘Data’ tab and set one.