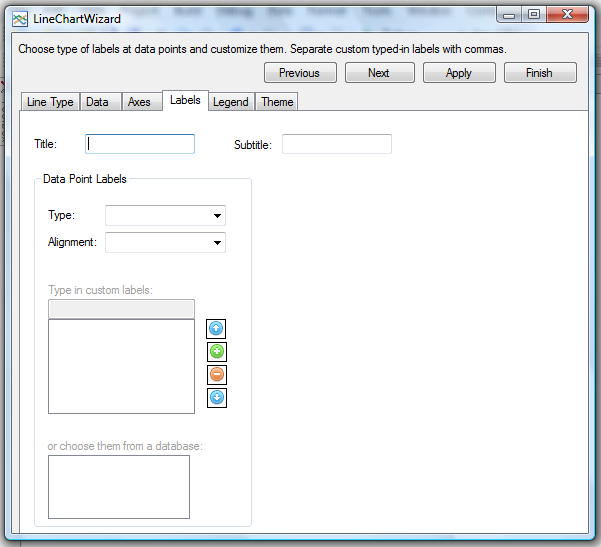
The ‘Labels’ tab has:
- Two text boxes at the top, where you can write the title and subtitle of the chart.
- A group of controls that let you set and customize labels shown at data points. Currently this is supported only by ‘Scatter’ line types, but they can be combined with all line and area charts.
- Select the type of the labels from the values in the ‘Type’ combo box.
- Choose whether the labels will be drawn above, under or in the middle of the scatter by selecting a value from the list of the ‘Alignment’ combo box.
- If you have chosen to display custom labels, write them in the Custom labels text box, separated with commas. Press ‘Enter’ when done.
- Use the buttons at the right of the list box with the data labels to edit, reorder, delete or add the lists.
- If you want to set labels from a database, check the desired columns in the check list box at the bottom of the group. The columns need not be only text (string) values. If no database connection is present, go to the ‘Data’ tab and create one.