


A. Create a radar chart with lines
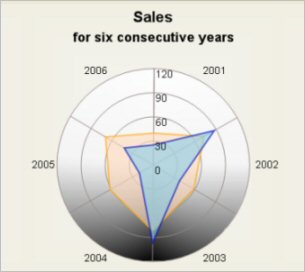
- Drag the radar chart icon to create a new chart
- Set the RadarType to Radar3D
- Set the RadarStyle to Lines
- Set a brush for the 3D background with Background3D property.
Adding data
- Add data for two series with the SeriesCollection Editor:
Series0: 39.88,72.47,58.48,81.65,62.17,69.07
Series1: 25.13,87.31,38.09,96.22,19.87,42.11 - Set the scale divisions for the inner axis. Set MinValue to 0, MaxValue to 120 and Span to 30.
Setting labels of the inner axis
- Set the label type of the inner axis with InnerAxisLabelType to
AxisLabelType.AutoScale. This will draw the scale divisions as axis labels. - Choose format of the inner labels with InnerLabelFormat. In the sample, it is set to NumberFormat.Fixed_point_0Digits.
- Choose position for the inner axis with InnerAxisPosition. In the sample, Position.Top is chosen.
Brushes and pens
- Set two brushes for filling the radar polygons with the BrushCollection editor and the ChartBrushes property.
- Add two pens for drawing the radar polygons with the PenCollection editor and ChartPens.
 Tip Tip |
|---|
Pens that are a bit darker than the respective brush make nice outlining. |
- Add a grey brush for drawing the biggest radar circle through OuterAxisPen.
- Set the pen for the inner axis with InnerAxisPen.
- Add the same pen to the AltAxesPens property using the PenCollection editor.
- Choose a brush for the background of the control with BackgroundBrush.
Setting labels of radar segments
- Add the labels for the radar segments with OuterLabels. Write there "2001, 2002, 2003, 2004, 2005, 2006".
- Set LabelFont to Arial, 9.75 pt.
Title and subtitle
- Write "Sales" as TitleText.
- Set TitleFont to Arial, 14 pt., style=bold.
- Write "for six consecutive years" as SubTitleText.
- Set the SubTitleFont to "Arial, 12 pt., style=bold"
B. Create a spider web radar chart with lines, point shapes and segments
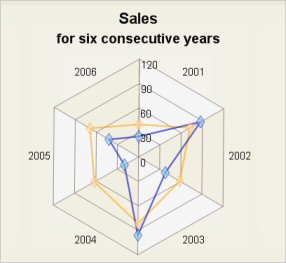
To create a spider web radar chart with lines, point shapes and segments replace steps 2, 3, 4 and 10 with the following steps:
- Set RadarType to Radar2D.
- Set the RadarStyle to Lines with Points, for example write "Lines,Points". Set SpiderWeb to true.
- Add the brushes for the segments with the SegmentBrushes property using the BrushCollection Editor.
- Copy the ChartBrushes to ShapeBrushes. Clear ChartBrushes so that the radar polygons will not be filled. Add the same pens in ChartPens and ShapePens.
| Tip |
|---|
You can make the shape pens a bit thinner. |
- Write the sizes of the shapes in ShapeSizes: "15,15"
- By default, shapes are drawn as rhombuses. You can set new shapes using the Shapes property. Copy the following code after InitializeComponent, in the constructor:
VB.NET
 Copy Code Copy Code
|
|---|
Me.RadarChart1.Shapes.Clear() |
| C#
Copy Code
|
|---|
this.radarChart1.Shapes.Clear(); |
C. Create a radar chart with arcs and sections
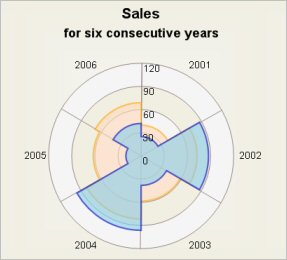
To create a radar chart with sections and arcs, replace steps 2, 3 and 4 from point A with the following steps:
- Set the RadarType to Radar2D
- Set the RadarStyle to Arcs.
- Add the brushes for the sections with the BrushCollection Editor to the SectionBrushes property. In the sample two brushes are used.
- Add the positions, at which the arcs are drawn to SectionPoints - "0, 25, 50, 75, 100". This creates 4 equally placed along the radius arcs.
The quotation marks ("") around values of data and label properties are not needed when writing them in the Property designer. Note