This tutorial will demonstrate how to create and bind DataRange objects manually and how to create master-detail relationship between data-ranges representing related tables. The following steps are explained in more details below:
- Prerequisites
- Adding a new data adapter
- Creating DataRange objects manually
- Setting MasterDetail relationship
- Running the application
Prerequisites
This tutorial continues from where Tutorial 1: Getting Started has ended. It is therefore assumed that we have an existing application with a single data-bound report in it and a form with a set up ReportViewer that displays an instance of this report.
1. Adding a new data adapter
Now that we have an existing data set and an adapter for the 'Products' table, we will expand this data source by creating an adapter for the 'Categories' table.
To do this, go to the 'Data Sources' window, select the 'nwindDataSet' and click the 'Configure DataSet with Wizard' button from the 'Data Sources' window toolbar. This will bring up the 'Data Source Configuration Wizard' that we used in Tutorial 1 in order to setup the data source initially.
 Note Note |
|---|
To open the 'Data Sources' window, select the Data -> Show Data Sources menu command. |
Expand the 'Tables' node and select the 'Categories' table by placing a check in the box to its left. Click 'Finish' to create a new table adapter for the selected table.
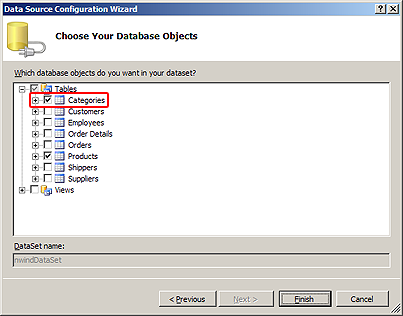
Rebuild the project to force the new table adapter to appear in the Visual Studio Toolbox. Add an instance of the CategoriesTableAdapter to the report by double-clicking on the adapter name.
2. Creating DataRange objects manually
In the previous tutorial we demonstrated how to create DataRange objects from an adapter automatically. To create a DataRange manually, drag it from the Toolbox and drop it onto the page surface. From the 'Properties' window set its Location to "0mm, 30mm" (this is temporary to prevent the data range from overlapping the previously created one) and its Size to "100%, 40mm".
Select the page and set its ContentSize to "180, 74" to ensure that the new DataRange will be visible in the designer.
To bind the new data range to the 'Categories' table, set its DataSource property to nwindDataSet1 and its DataMember property to "Categories". The new DataRange is now positioned and data-bound.
To add a label to the data range, simply drag the label from the Toolbox and make sure to drop the label onto the data range surface within the Designer. To ensure that the label is placed within the data range, select the label once it is positioned and press the ESCAPE key. This should select the label's parent, which in this case should be the newly created data range. Set the Location of the new label to "2mm, 2mm", its Size to "50%, 6mm" and its DataField to "CategoryName".
Add a Picture element to the data range. Set its Location to "60%, 2mm", its Size to "38%, 36mm" and its DataField to "Picture".
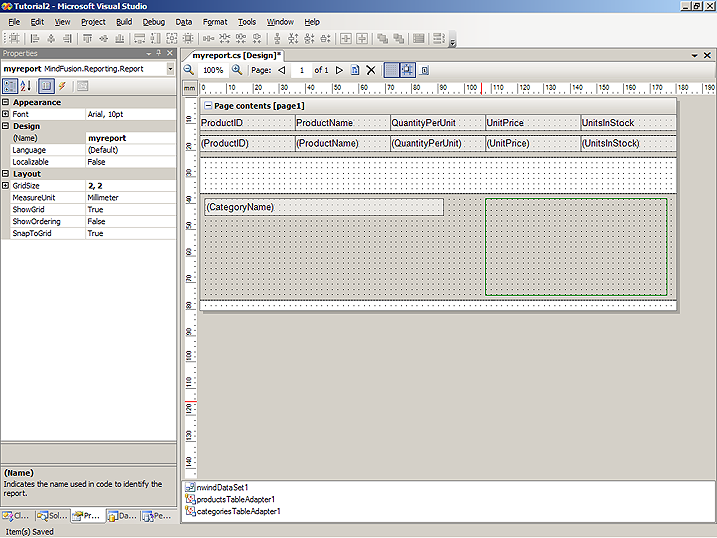
The report containing the two data ranges should now look similar to the following (the newly created data range is outlined in red):
3. Setting MasterDetail relationship
In order to create master detail relationships between the two data range elements, we have to embed them into one another. To do this, select the first data range object in the Designer and drag it onto the second one.
 Note Note |
|---|
To drag a data range, click on the |
Adjust the position of the dragged data range. Set its Location to "2mm, 20mm" and its Size to "50%, 8mm". Finally move the containing data range at the beginning of the report, by settings its Location to "0mm, 0mm". The following image illustrates the result:
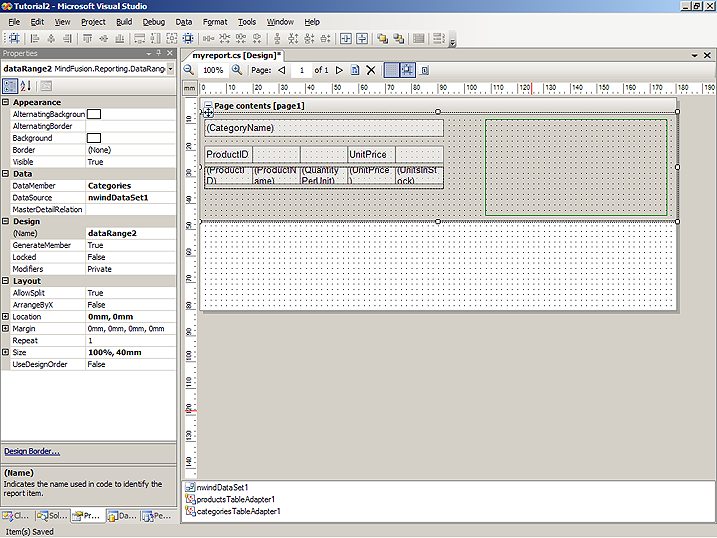
Now we have to setup the MasterDetailRelation property of the internal (embedded) data range. The name of the relation can be obtained from the data set designer.
To open the data set designer, navigate to the nwindDataSet.xsd file in the 'Solution Explorer', right-click on it and select the 'View Designer' command from the context menu. A database relationship diagram will be displayed. Select the relation connecting the 'Products' and 'Categories' tables in the diagram and open the 'Properties' window. The Name property contains the value ("CategoriesProducts" in our case) that should be set to the MasterDetailRelation property of the embedded data range.
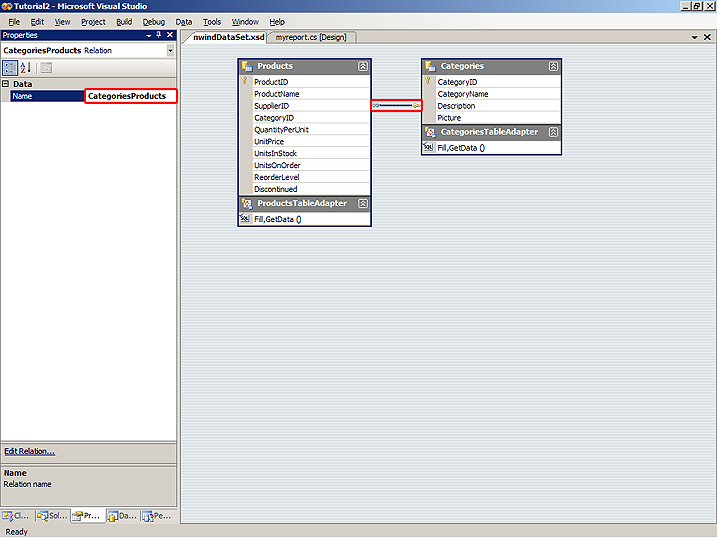
Go back to the Report Designer, select the internal data range (the one bound to the 'Products' table) and set its MasterDetailRelation property to "CategoriesProducts".
Finally modify the report's constructor like this (the new lines are outlined in bold):
C#
 Copy Code Copy Code
|
|---|
public myreport() |
Visual Basic
 Copy Code Copy Code
|
|---|
Public Sub New() |
4. Running the application
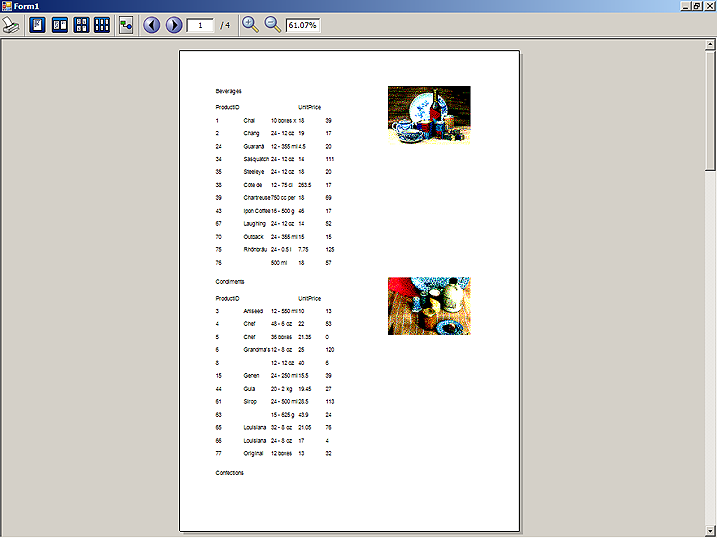
The main application form should remain unchanged from Tutorial 1. Running the application will yield a result similar to the one illustrated by the following image:
