
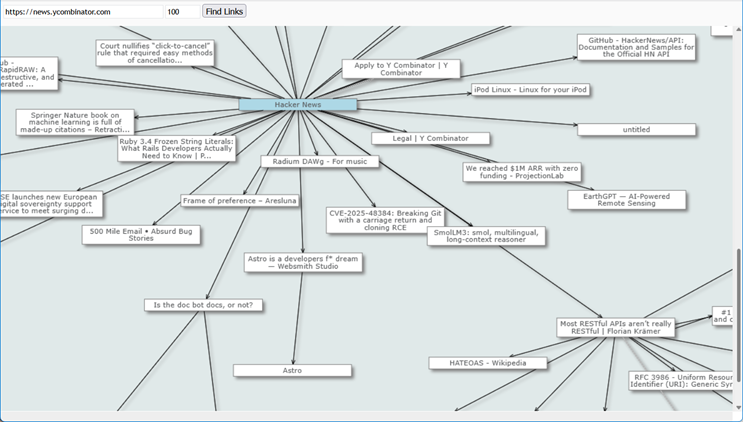
In this post, we’ll walk through the process of creating a simple application that can crawl the web starting from a given URL, and visualize the hyperlinks it finds as an interactive web graph. We will accomplish this using pure JavaScript and the MindFusion.Diagramming library, which provides the powerful features needed for graph creation, layout, and interaction.
The full source code for this example is available here:
https://mindfusion.eu/_samples/WebGraph.zip
Setting Up the Diagram
The first step is to set up the host page and initialize the core objects from MindFusion API: Diagram and DiagramView. This is done within a DOMContentLoaded event listener where we have access to the canvas element. We also perform some initial styling, such as setting the arrowhead sizes and creating a Theme object:
var diagram = null;
var diagramView = null;

document.addEventListener("DOMContentLoaded", function ()
{
    diagram = new Diagram();

    // DiagramView control renders the diagram
    diagramView = DiagramView.create(document.getElementById("diagram"));
    diagramView.diagram = diagram;
    diagramView.mouseWheelAction = MindFusion.Diagramming.MouseWheelAction.Zoom;

    // tweak appearance
    diagram.linkHeadShapeSize = 2;
    diagram.showGrid = false;
    diagram.backBrush = "#e0e9e9";

    // style nodes using a theme
    var theme = new Theme();
    var shapeNodeStyle = new Style();
    shapeNodeStyle.brush = "white";
    shapeNodeStyle.stroke = "#7F7F7F";
    shapeNodeStyle.textColor = "#585A5C";
    theme.styles.set("std:ShapeNode", shapeNodeStyle);
    diagram.theme = theme;
});
The Crawling Logic
The core of our application is the web crawler. We use setInterval to create a processing loop that runs every 100 milliseconds. This loop manages a queue of URLs to be fetched. To prevent getting stuck by backlinks, we use a Set called fetchedPages (why do web crawlers hate trampolines? – they get stuck in a jump loop ;))
We also track the number of activeFetches to ensure the process doesn’t terminate while requests are still in flight. The crawling process stops when the queue is empty and no fetches are active, or when we reach the user-defined maximum number of pages:
function crawlTick() {
    // stop when queue is empty and all fetches are done,
    // or if we hit the maxPages limit
    if ((queue.length === 0 && activeFetches === 0) || nodes.size >= maxPages) {
        clearInterval(crawlTimer);
        arrangeDiagram();
        return;
    }

    // if queue is empty, but fetches are still running, wait for them to complete
    if (queue.length === 0) {
        return;
    }

    // get next URL from queue
    var currentLink = queue.shift();
Fetching, Parsing, and Building the Graph
As we process a page, we create a ShapeNode for it by calling diagram.factory.createShapeNode. We store this node in a Map that associates the URL with its diagram node. That allows us to easily find existing nodes and create DiagramLink instances between them, visualizing our graph.
// create a diagram node representing target page
if (!nodes.has(currentLink.toPage))
{
	// we'll arrange automatically later
	var node = diagram.factory.createShapeNode(1000, 1000, 50, 20);

	// remember the target URL to open from click events
	node.hyperLink = currentLink.toPage;
	node.tooltip = currentLink.toPage;

	// map URL to diagram node
	nodes.set(currentLink.toPage, node);
}

// create a diagram link representing the hyperlink
var fromNode = nodes.get(currentLink.fromPage);
var toNode = nodes.get(currentLink.toPage);
if (fromNode && toNode) {
	var link = diagram.factory.createDiagramLink(fromNode, toNode);
	link.zIndex = 0;
	if (toNode.incomingLinks.length > 1)
		link.stroke = "lightGray";
}
For each URL dequeued in our crawlTick, we perform several actions. First, we fetch the page’s HTML content. Note that due to browser CORS (Cross-Origin Resource Sharing) policies, fetching HTML from a different domain directly from client-side JavaScript is blocked. Our implementation uses a simple local Node.js proxy to bypass this (run npm start to start the proxy, while WebGraph.html itself can be opened from the file system).
Once we receive the page content, we use browser’s built-in DOMParser to turn the string into a traversable DOM document. From this document, we can easily extract the page title and all hyperlink (<a>) tags. New, unique hyperlinks found on the page are added to the back of the queue for future processing.
// Request the page through server proxy
fetch(`http://localhost:3000/proxy?url=${encodeURIComponent(currentLink.toPage)}`)
    .then(response => response.text())
    .then(html => {
        // parse the page to extract title
        var parser = new DOMParser();
        var doc = parser.parseFromString(html, "text/html");

        var pageNode = nodes.get(currentLink.toPage);
        if (pageNode) {
            var text = doc.title || "untitled";
            if (text.length > 80) {
                text = text.substring(0, 80) + "...";
            }
            pageNode.text = text;
        }

        // ... and a list of hyperlinks
        var links = doc.querySelectorAll('a');
        links.forEach(link => {
            var address = link.getAttribute('href');
            if (address && (address.startsWith('http') || address.startsWith('https'))) {
                // Add to queue to process on next timer tick
                if (!fetchedPages.has(address) && fetchedPages.size < maxPages) {
                    queue.push({fromPage: currentLink.toPage, toPage: address});
                }
            }
        });
    })
Automatic Layout and Interactivity
After the crawler has finished, our diagram contains all the nodes and links, but they aren’t yet positioned. Let’s apply SpringLayout to automatically arrange the graph:
function arrangeDiagram() {
    // automatically arrange nodes and links
    var layout = new MindFusion.Graphs.SpringLayout();
    diagram.arrange(layout);
    diagram.resizeToFitItems(5);
    diagramView.bringIntoView(diagram.nodes[0]);
}
Finally, to make the graph interactive, we add a handler to diagram’s nodeClicked event. In the handler, we retrieve the URL stored in the node’s hyperLink property and open it in a new browser tab:
function onNodeClicked(sender, args) {
    // open the hyperlink in a new tab
    if (args.node.hyperLink) {
        window.open(args.node.hyperLink, '_blank');
    }
}
Conclusion
Using timer-based processing loop and the features of MindFusion.Diagramming library, we’ve created a functional web crawler and visualizer with a small amount of code. This example demonstrates how to represent and interact with complex network data, and can serve as a foundation for more advanced analysis and visualization applications.
Code above demonstrates MindFusion’s JavaScript diagramming library, but we support same API (model and layout classes, events) in our .NET and Java libraries.
Enjoy!