In this blog post we will demonstrate how you can implement methods that save and load part of the information that a diagram renders into JSON format. The Diagram class has built-in toJson and fromJson methods. They serialize completely the diagram with every detail so you can restore it completely, exactly the way you see it. What we are going to do is write custom save and load methods that use only part of the information – namely the size and location of nodes and links as well as their text.
Category Archives: JavaScript
Candlestick Financial Chart in JavaScript with Real-time Data
In this blog post we will build the financial chart that you see below. This is a candlestick chart created with MindFusion Charting for JavaScript. We use data from the platform TraderMade. The data comes in a continuous stream as a WebSocket. The blog post explains how to get the data, how to parse it and how to create and customize the chart. The chart also offers the user to change the data interval and to zoom in/out the chart.

Render Online Maps Using Your Own Tile Map Files and MindFusion Mapping Library for JavaScript
In this blog post we are going to show you how to use the free mapping files, available for download from various resources and convert them to image files so they can be rendered through the URL http://your_website/files_location/{z}/{x}/{y}.png You will get acquainted with various sources of map data files, different tools to convert and export the files into raster images. Finally, you will use MindFusion’s JS Mapping library to create a map that uses the image files, you have prepared and uploaded on your own server.

Continue reading
An Interactive Map with All FIFA World Cup Hosts and Winners
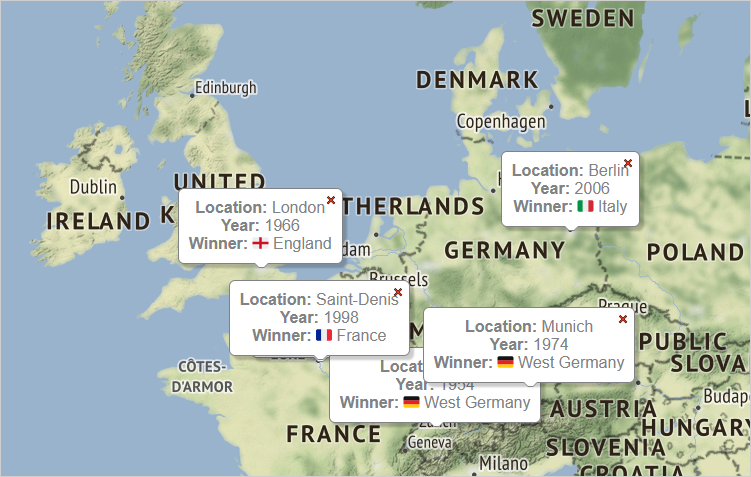
In this article we are looking at the steps you need to make to build this beautiful, interactive map:
The map has several layers and markers in the cities that hosted the football world cup tournament. Optionally, users can show info labels that describe the tournament year and the winner.
Continue reading
Using MindFusion ToolStrip Library in JavaScript
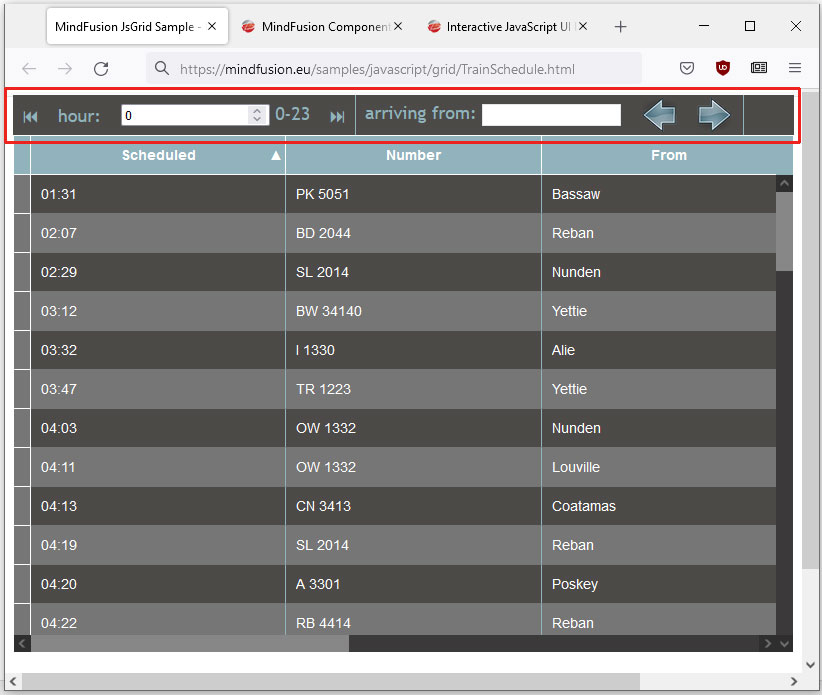
In this blog post we are going to look at the way you can build the ToolStrip that you see at the image below. We use the ToolStrip control, which is part of MindFusion Pack for JavaScript. Here is the final result:

We will go through the process of creating the toolstrip step-by-step, from scratch, clarifying the most important details.
You can run the sample online at https://mindfusion.eu/samples/javascript/grid/TrainSchedule.html


