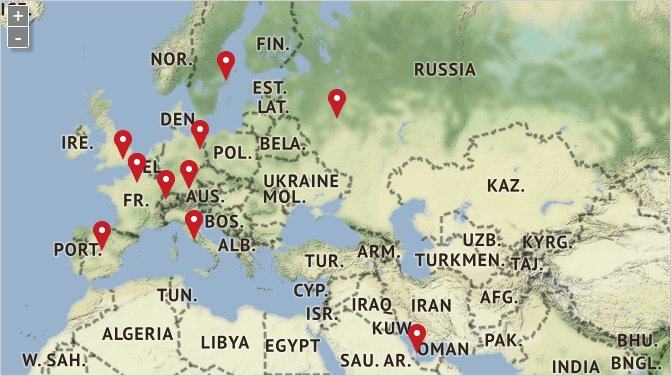
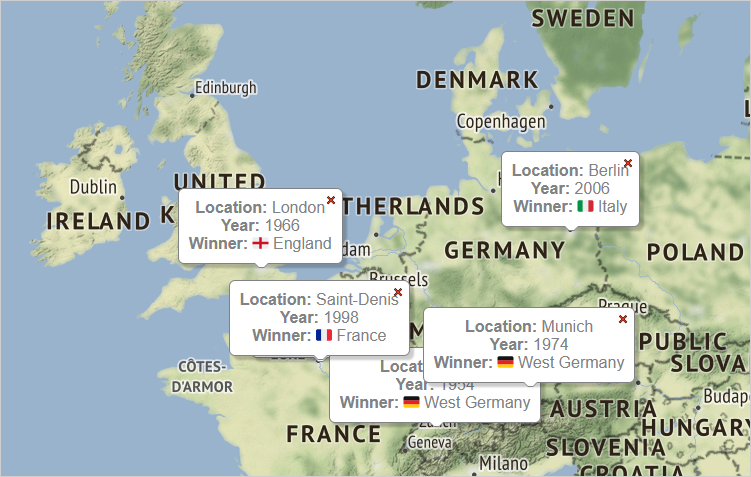
In this article we are looking at the steps you need to make to build this beautiful, interactive map:
The map has several layers and markers in the cities that hosted the football world cup tournament. Optionally, users can show info labels that describe the tournament year and the winner.
I. General Setup
In order to use MindFusion mapping library for JavaScript, we need to reference its script files. We need the following files:
<script src="Scripts/drawing.js" type="text/javascript"></script>
<script src="Scripts/controls.js" type="text/javascript"></script>
<script src="Scripts/common.js" type="text/javascript"></script>
<script src="Scripts/common-collections.js" type="text/javascript"></script>
<script src="Scripts/mapping.js" type="text/javascript"></script>
We add them at the end of our web page, right before the closing BODY tag. We also need to add a DIV element that represents the map: the mapping library will use it to render itself into it. It is important that we give the DIV element an id:
<div id="content" style="top: 5px; bottom: 24px;">
	<div style="position: absolute; width: 100%; height: 100%;">
		<div id="mapView" style="height: 100%; width: 100%;">
		</div>
	</div>
</div>
II. Creating the Map
We create the map by using the DIV element we’ve initialzed in the web page. The map is represented by a MapView object. The decorations and different maps are layers to the MapView .The map loads images as tiles provided by a TMS (tile map service) server. We use for the sample Stamen maps, but you can use any other.
var view = new m.MapView(document.getElementById("mapView"));
// add a map layer
var l = new m.MapLayer("Map");
l.urlTemplate = "https://stamen-tiles.a.ssl.fastly.net/terrain/{z}/{x}/{y}.jpg";
l.attribution = 'Map tiles by <a href="http://stamen.com">Stamen Design</a>, under <a href="http://creativecommons.org/licenses/by/3.0">CC BY 3.0</a>. Data by <a href="http://openstreetmap.org">OpenStreetMap</a>, under <a href="http://www.openstreetmap.org/copyright">ODbL</a>.';
view.layers.add(l);
The MapView control supports themes, which mostly differ in the color of the zoom control and the location themes. In order to use a theme, you need to set the theme property of the class to the name of the theme:
view.theme = "standard";
The library includes a list of predefined themes, which you need to reference as CSS files first. You can use them as a base to create your own themes.
II. Location Pins
The layer with map pins that mark the locations of world cup tournaments is an instance of the DecorationLayer class. We create Marker objects and add it to the decorations list of the layer. The locations are LatLong instances, that specify the latitude and longitude of each location. We keep them in JavaScript object, together with the city name, the year and who the winner was:
var worldCupLocations = [
	 { location: new m.LatLong(47.751076, -120.740135), city: "Washington", year: 2026, winner: "unknown" },
	 { location: new m.LatLong(45.424721, -75.695000), city: "Ottawa", year: 2026, winner: "unknown" },
	 { location: new m.LatLong(19.432608, -99.133209), city: "Mexico City", year: 2026, winner: "unknown" },
	 { location: new m.LatLong(25.285446, 51.531040), city: "Doha", year: 2022, winner: "unknown" },
...........................
...........................
}];
We create the markers in a foreach loop:
// create some markers with default css styling
worldCupLocations.forEach(
	function (tournamentHost){
		this.decorations.add(new m.Marker(tournamentHost.location));
	}, pins);
We also make the later visible and add it to the layers collection of the MapView
// add a decoration layer for world cup images
var markers = new m.DecorationLayer("World Cup Markers");
markers.visible = true;
view.layers.add(markers);
When you create any type of layer, you can specify its label in the constructor. The label appears as a map legend. Here is how the map looks with the pins:

III. The Captions
For the captions we need a new DecorationLayer It will hold Bubble instances, whose text property will render the text. The text property supports styled text and we can use HTML formatting tags to make our bubble beautiful.
var bubble = new m.Bubble(tournamentHost.location);
bubble.text = ">div align="\"center\""<>strong<Location:>/strong< "  + tournamentHost.city + 		"
>strong<Year:>/strong< "+ tournamentHost.year + "
>strong<Winner:>/strong< " + tournamentHost.winner + ">/div<";
bubbles.decorations.add(bubble);
We use the array with data to take the right info for each bubble. Be default this layer is also not visible but users can show it from the map legend.
And that was the last feature we had to add to our web application. You can download the sample together with all libraries used from the following link:
Technical support is available on MindFusion forums at the Help Desk or per email support@mindfusion.eu.
About Mapping for JavaScript: The library enables any type of web application to render an interactive map through its preferred Tiled Map Service. A special property allows the developer to credit the map service, if necessary. The library boasts a layer and a zoom control. Multiple layers are supported, which can hold pins, decorations or info bubbles. The labels support HTML formatted text. The various events allow you to respond to user actions in a way that’s most suitable to your application. Learn more about Mapping for JavaScript at https://mindfusion.eu/javascript-map.html.

