In this blog post we will demonstrate how you can implement methods that save and load part of the information that a diagram renders into JSON format. The Diagram class has built-in toJson and fromJson methods. They serialize completely the diagram with every detail so you can restore it completely, exactly the way you see it. What we are going to do is write custom save and load methods that use only part of the information – namely the size and location of nodes and links as well as their text.
Author Archives: Diana
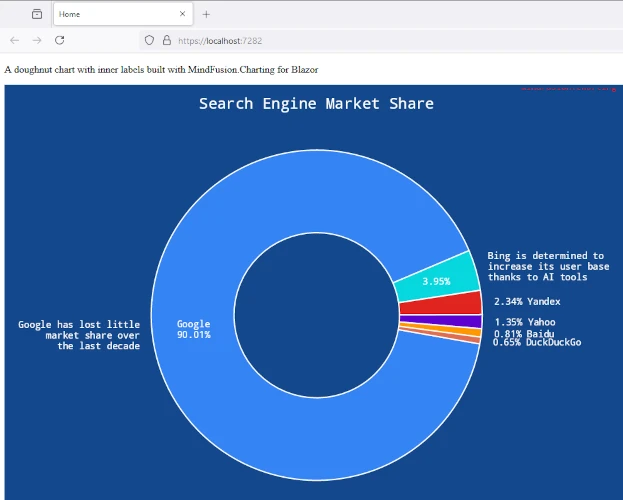
A Dougnut Chart in .NET Blazor
In this blog post we are going to walk through the steps necessary to build the beautiful doughnut chart that you see at the image below:

We are going to use MindFusion Charting library for Blazor and Visual Studio as the IDE for the project.
Candlestick Financial Chart in JavaScript with Real-time Data
In this blog post we will build the financial chart that you see below. This is a candlestick chart created with MindFusion Charting for JavaScript. We use data from the platform TraderMade. The data comes in a continuous stream as a WebSocket. The blog post explains how to get the data, how to parse it and how to create and customize the chart. The chart also offers the user to change the data interval and to zoom in/out the chart.

Running MindFusion ASP.NET MVC Diagram Under a Linux Server
In this blog post we are going to look at the steps required to run the MindFusion Diagramming library for ASP.NET MVC under a Linux server.

Diagramming for WinForms 7.0 Beta
We have released the new FlowChart.NET for public beta testing a few weeks ago. Diagramming for WinForms V7.0, as its the official name, offers some appealing new features. The most eye-catching is certainly the ability to animate nodes or the entire diagram.
Animations
Nodes can be animated in a variety of ways.


