This post shows how to add custom graphics to a chart by inheriting the SeriesRenderer class. We’ll use it to show marker lines on top of an area chart, which could be used to emphasize important values (e.g. dates on a timeline).


This post shows how to add custom graphics to a chart by inheriting the SeriesRenderer class. We’ll use it to show marker lines on top of an area chart, which could be used to emphasize important values (e.g. dates on a timeline).

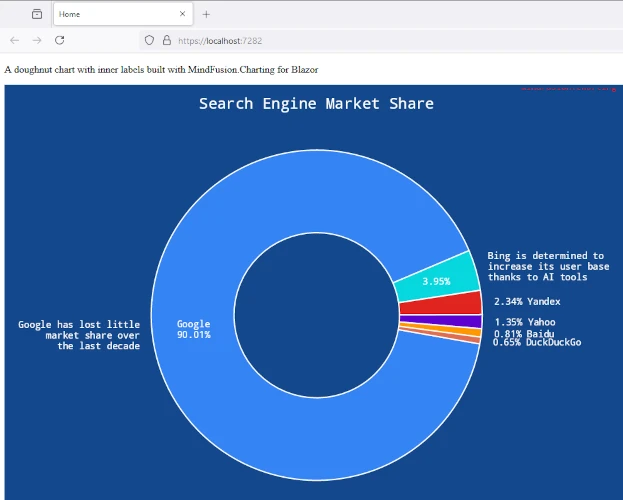
In this blog post we are going to walk through the steps necessary to build the beautiful doughnut chart that you see at the image below:

We are going to use MindFusion Charting library for Blazor and Visual Studio as the IDE for the project.
In this blog post we will build the financial chart that you see below. This is a candlestick chart created with MindFusion Charting for JavaScript. We use data from the platform TraderMade. The data comes in a continuous stream as a WebSocket. The blog post explains how to get the data, how to parse it and how to create and customize the chart. The chart also offers the user to change the data interval and to zoom in/out the chart.

In this blog post we will look in short at the steps to build this JavaScript area chart with custom grid:
The line chart uses DateTimeSeries for the data and a standard GridType for the major grid lines. The auxiliary grid lines among them are made with custom drawing: we will discuss in details the code for that.
The sample uses MindFusion Charting library for JavaScript, which also supports TypeScript.
You can see the sample online at https://mindfusion.eu/samples/javascript/chart/CustomGrid/DateTimeSeries.html
In this blog post we will look at two ways to load the Scheduling library for Java Swing from Maven using Apache NetBeans IDE. In our previous blog post we looked at how to add the library from a local *.jar file. Now we will load it interactively from Maven. MindFusion’s repositories on Maven can be found at https://search.maven.org/search?q=mindfusion.
In the sections below we will look on how to load the Scheduling library from Maven and use it in a:
We test that the scheduling library was successfully loaded by showing a simple calendar:
