
MindFusion has released a new version of its diagramming library for JavaScript. Here is an overview of
the most important new features in the control:
Node Effects
You can now apply two visual effects to your nodes – the GlassEffect and AeroEffect. In order to apply
an effect, create an instance of the respective class, set its properties and add the instance to the
Effects collection. You can add, remove or modify effects at any time and this will immediately affect the appearance of the diagram. You can apply effects of different types simultaneously.
Visual effects applied on diagram nodes.
Multiple labels per link
The new LinkLabel class lets you display multiple captions for a single DiagramLink object. You can fully
customize the display and positioning of the link labels. The new LinkLabel.AutoArrange property lets you arrange automatically the labels to avoid overlapping.
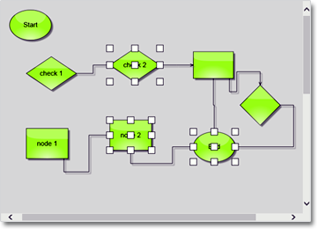
Selection of multiple items.
New events
- nodeSelected and linkSelected events are now raised when an item is selected, either programmatically or by the user.
- nodeDeselected and linkDeselected events are now raised when an item is deselected, either
programmatically or by the user. - nodeDoubleClicked and linkDoubleClicked events are raised when the user double clicks an item.
- nodeCreating is now also raised while the user drags a node from the NodeListView control.
Miscellaneous
- The new setVirtualScroll method enables the virtual scrolling mode. In this mode, the canvas stays as big as its containing div, and its content is drawn with a translation bound to the div’s scrollbar positions. This allows displaying large diagrams in browsers and on mobile devices where the size of the HTML canvas elements is limited.
- resizeToFitText method is added to ShapeNode.
- Improved support for nested containers.
You can find out more about the new release at the Diagramming News section on our forum. You are welcomed to download the trial version and check yourself the capabilities of the control. Use the link below:
Download MindFusion.Diagramming for JavaScript Library 1.6
We have always taken special effort in providing quality technical support to all our clients and evaluators. You can write us at e-mail support@mindfusion.eu or use the help desk. You can use the JsDiagram section on MindFusion forum to post questions about the tool.
About Diagramming for JavaScript Library: Written 100% in JavaScript, this tool uses HTML5 Canvas to draw impressive diagrams, schemes, flowcharts, trees and many more. It is browser independent, easy to use and integrate into any web application. JsDiagram supports a variety of predefined node shapes, customizable links, rich event set and many appearance options. The user interaction model includes resizing / moving / selecting and modifying any diagram element.
The tool boasts an elegant API, which is documented in details as well numerous step-by-step guides and tutorials. Various samples are provided to let you learn quickly how to use the most important features of the library – check them here. JsDiagram is not only the perfect choice for creating any type of diagram in the browser – it can also arrange it the way you wish with a mouse click using one of its automatic graph layout algorithms. For more details about the features of the component, please visit the features page.