C#
 Copy Code Copy Code
|
|---|
this.lineChart1.LineType = MindFusion.Charting.LineTypes.Scatter; |
VB.NET
 Copy Code Copy Code
|
|---|
Me.LineChart1.LineType = MindFusion.Charting.LineTypes.Scatter |
- Set the chart background with the BackgroundBrush property.
- Set the background of the plot area with PlotAreaBrush.
- Use AxisPen to specify the pen for the axes - in this sample it is a grey one, width 2.
- Create a grid: set the GridType to HorScale, and then choose a GridBrush and AltGridBrush. Set the GridPen to a dashed one.
C#
 Copy Code Copy Code
|
|---|
this.lineChart1.GridType = MindFusion.Charting.GridType.HorScale; |
VB.NET
 Copy Code Copy Code
|
|---|
Me.LineChart1.GridType = MindFusion.Charting.GridType.HorScale |
- Set the title label - enter 'Scatter Chart' in the TitleText property field. Use TitleFont and TitleBrush to set the font and color of the title.
C#
 Copy Code Copy Code
|
|---|
this.lineChart1.TitleText = "Scatter Chart"; |
VB.NET
 Copy Code Copy Code
|
|---|
Me.LineChart1.TitleText = "Scatter chart" |
- Specify Verdana, 10 pt. font for the labels with LabelFont.
- Specify the data for the chart - enter 1,3,5,7,9 in the XData property using the SeriesCollection editor.
C#
 Copy Code Copy Code
|
|---|
this.lineChart1.XData = new MindFusion.Charting.SeriesCollection("1,3,5,7,9"); |
VB.NET
 Copy Code Copy Code
|
|---|
Me.LineChart1.XData = New MindFusion.Charting.SeriesCollection("1,3,5,7,9") |
- Enter two series of data in the YData property: Serie0: 30,44,18,33 and Serie1: 10,20,35,22 by using the SeriesCollection Editor.
C#
 Copy Code Copy Code
|
|---|
this.lineChart1.YData = new MindFusion.Charting.SeriesCollection("30,44,18,33;10,20,35,22"); |
VB.NET
 Copy Code Copy Code
|
|---|
Me.LineChart1.YData = New MindFusion.Charting.SeriesCollection("30,44,18,33;10,20,35,22") |
- Set the following properties of the X-axis with the XAxisSettings object:
- Set the label type to ChartData with AxisLabelType.
- Specify the length of the axis - enter 400 in the AxisLength field.
- Set the MinValue to 0, the MaxValue to 8 and the AxisDelta to 1. This divides the axis in 8 intervals and the scatter shapes fill nicely into the plot area.
- Set the NumberFormat of the labels to Fixed_point_0Digits.
- Set the appearance options for the Y-axis with the YAxisSettings property:
- Set AxisLabelType to AutoScale
- Set DivMarkerAlignment to Far to draw the scale divisions out of the plot area towards the labels
- Set the length of the scale divisions to 5, that is DivMarkerLength = 5
- Set the YAxisSettings.DrawZero property to true to show the zero label at the Y-axis.
- Specify the type of Shape-s that you want for the scatter chart. Add the chosen values to the Shapes property, clear any already added Shape objects beforehand. Update the chart with the newly set options. Write the following lines of code in the constructor of the Form, which contains the chart control, after InitializeComponent:
C#
 Copy Code Copy Code
|
|---|
this.lineChart1.Shapes.Clear(); |
VB.NET
 Copy Code Copy Code
|
|---|
Me.LineChart1.Shapes.Clear() |
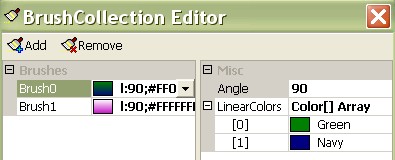
- Choose the brushes for the scatter shapes. Use ShapeBrushes and add two brushes for both YData series by using the BrushCollection Editor:

- Use the ShapePens property to specify the pens that draw the outlining of the scatter Shapes. Add and edit the pens with the PenCollection Editor.
- Set the size of the scatter shapes using ShapeSizes. Enter the desired values, for example 20 and 30, separated by commas in the Property Designer of Visual Studio, for example write "20,30".
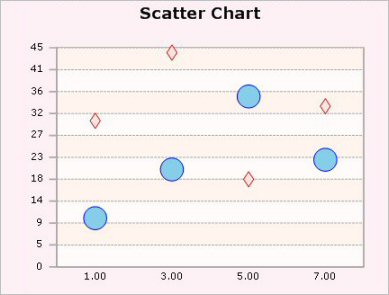
- The Scatter chart will be updated with the described settings:


