


A. Create a new Visual Studio Project
- Open Visual Studio.
- On the File menu, select New, and then choose Project.
- Select the desired project type from the list of installed templates.
- Type the name of your project, and click OK.
B. Create a line chart object
- Click on the LineChart icon in the Toolbox, and drag it to the form's working area. This creates a new line chart object.
- Click on the selection handles and expand the area of the control as desired.

C. Set the properties of the LineChart object
- Select the newly created LineChart object by clicking in the area within the form.
- Set the LineType to Line3D.
 Note Note |
|---|
To display properly the 3D line chart, set the Depth3D property to a value greater than zero, for example to 30. |
- Enter 'Products' in the TitleText property field, choose bold Verdana TitleFont, size 16pt.
- Set the ChartPens property by using the PenCollection Editor.
Choose blue Pen0 and green Pen1, Width = 3.

- Set the ChartBrushes property to light blue and light green colors by using the PenCollection Editor.
- Set GridType to HorScale, choose Light Gray GridBrush and GridPen of Dot Style.
- Set AltGridBrush to Gradient Style, from white start color to pink end color.
| Note |
|---|
To draw the chart by using of curves, set the Curve property to true. |
D. Set data for the line chart
Add XData and YData values for two series.
- Click the XData property in the Properties window.
- The SeriesCollection Editor appears. Add the XData values in one series. In this way, both line graphics will have the same X values.

- Add YData values in two series

For a line chart to be drawn, the count of members in both XData and YData lists must be equal. If the count of lists in XData is not equal to the count of lists in YData, the control cycles through them. If the count of numbers in lists at matching positions in XData and YData are not equal, the control completes the list with less values automatically. Note
E. Set the XAxisSettings and YAxisSettings properties
- Set LabelType of the XAxis to CustomText.
- Enter 'Months' in the TitleLabel field for the X axis, and enter 'Sales' in the TitleLabel field of the Y axis.
- Set LabelType of the YAxis to AutoScale.
- Set TitleLabelFont to Verdana, bold, and 14pt size.
- Set DataFormat to Fixed_point_0Digits.
F. Set the labels of the line chart
- Select the XLabels property. The LabelsCollection Editor appears.
- Enter the XLabels values: 'Jan,Feb,Mar,Apr,May,Jun,Jul,Aug,Sep,Oct'

- Set LabelFont to Verdana, size 14.
- Set YAxisSettings.DrawZero to true to show the zero label.
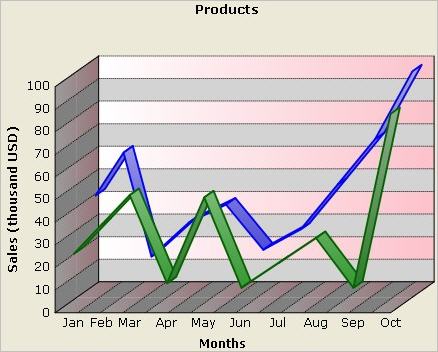
Click in the Form area. The line chart is displayed according to the specified properties values as shown below.
| Note |
|---|