src="product_images/buy_diagramlite.png">
MindFusion JS Chart combines 2D and 3D charts, financial graphs, gauges and dashboards. Elegant API, rich event set, unlimited number and type of data series and everything else you might need to create the perfect data visualization in JavaScript.

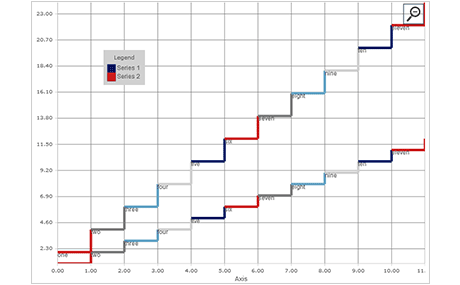
JavaScript Chart supports all popular chart types and their variations: pie, doughnut, bar, column, radar, polar, line, area, scatter, bubble, step charts. The elegant API of the control allows you to combine series of different types on a single plot. You can also add unlimited number of legends, a title and a subtitle, labels on various chart elements.
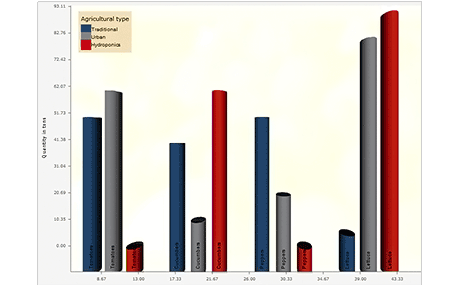
MindFusion uses WebGL to create beautiful 3D bar charts in JavaScript. The 3D library lets you create horizontal or vertical bar charts, choose among several bar layouts and two models: bar and cylinder. A 3D chart provides the full set of chart options like interactive legend, pan and zoom, labels and the ability to adjust colors, fonts and place an image as a background.

The dashboard class allows you to combine charts and gauges of your choice in a single JavaScript dashboard. You have the advantage to use a single plot with many axes or multiple plots with a single set of axes. Scroll and zoom is applied to the dashboard as a single object. Another powerful option is dynamic layout, which optimizes the available space and allocates to each dashboard element an optimal value according to its initial size and location.
JS Candlestick charts are the perfect addition to your JavaScript business application. The special StockPriceSeries class lets you easily specify StockPrice data, which consists of open, close, high and low values. The candlesticks are drawn with a brush set of your choice - you can also leave the stick empty. You can complete your financial chart with DateTime labels on the axis and a grid.
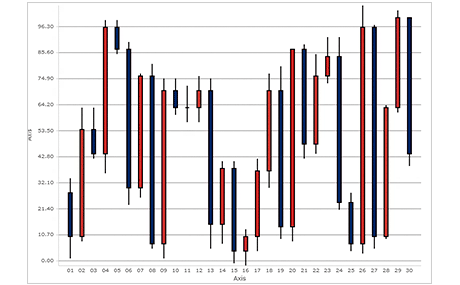
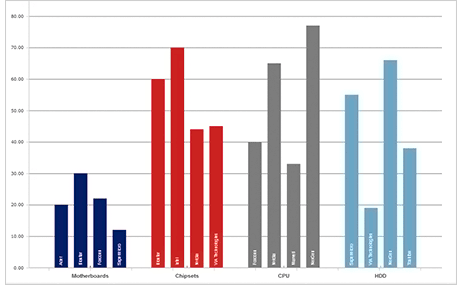
Chart js uses a universal Series interface, which provides data for all chart types. This approach greatly simplifies programming and allows easy implementation of various data types including custom data objects. The library ships with a predefined set of all common data types - numbers, DateTime values and XML data. Each chart supports unlimited number of series.
The JavaScript chart library could track the tiniest mouse movements over the graphic. The API provides you with numerous options to respond to user actions like change colors, labels, show tool tips. Each legend can be dragged with the mouse. Panning and zooming is enabled by default and you will be amazed how smooth they are performed even on charts with large data points.

Themes are built in for the js chart and you can create the desired color scheme and reuse it whenever you want on any chart type. The theme editor offers a user friendly interface to create your theme. As a start, you have a set of predefined themes, everyone in a different color set, which let you achieve the desired looks at once. In addition, every chart element is customized through a property, which overrides the theme, if one is set. You can adjust fonts, colors, brushes for every type of label, axis, bar, or pie piece, even grid stripes.
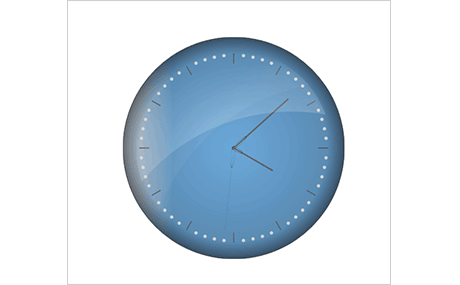
The chart library ships with oval and linear gauges and a rich set of samples that demonstrate the most popular use-case scenarios: thermometer, clock, compass, car dashboard etc. The linear gauges can be horizontal or vertical. Each gauge part can be customized, styled or custom-drawn.
