
In this blog post we will use the WPF Diagram component to build a fishbone diagram as described in the Wikipedia “Ishikawa diagram” article cited below:
“Ishikawa diagrams (also called fishbone diagrams, herringbone diagrams, cause-and-effect diagrams, or Fishikawa) are causal diagrams created by Kaoru Ishikawa that show the causes of a specific event.
Common uses of the Ishikawa diagram are product design and quality defect prevention to identify potential factors causing an overall effect. Each cause or reason for imperfection is a source of variation. Causes are usually grouped into major categories to identify and classify these sources of variation.” Read more on https://en.wikipedia.org/wiki/Ishikawa_diagram
This tutorial will demonstrate how easy it is to create the same diagram using the WPF diagram library and writing several lines of code. This is the final diagram:
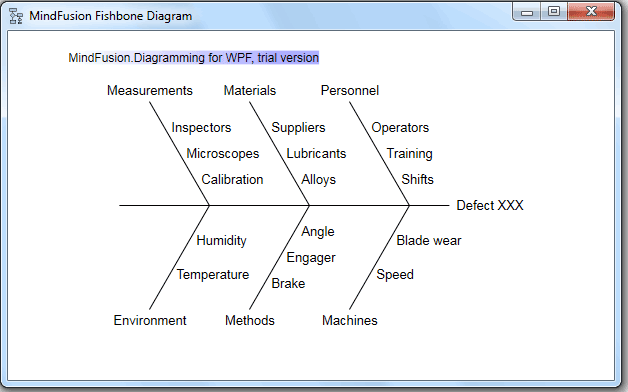
Ishikawa (fishbone) diagram in WPF with MindFusion WPF Diagram library
I. General Settings
We create an empty WPF project in Visual Studio called “Fishbone”. There we create an Assemblies folder where we place the necessary dll-s:
- MindFusion.Common.dll
- MindFusion.Diagramming.Wpf.dll
Then in the MainWindow.xaml file we create a mapping to the Diagramming namespace:
<window x:class="Fishbone.MainWindow" xmlns="http://schemas.microsoft.com/winfx/2006/xaml/presentation" xmlns:x="http://schemas.microsoft.com/winfx/2006/xaml" xmlns:diag="http://mindfusion.eu/diagramming/wpf" title="MindFusion Fishbone Diagram" height="387" width="622">
</window>
Then we create the diagram inside the default Grid WPF control:
<grid>
 <diag:fishbonediagram x:name="fdiag">
 </diag:fishbonediagram>
</grid>
The code creates a new instance of the FishboneDiagram* class with the name “fdiag”. We can use this name to access the object in code.
II. Diagram Data
The FishboneDiagram class exposes an ItemsSource property that provides data for the diagram. The data is an object that contains the label for the main Clause and a list with the labels of the subclauses. We create a special class called FBClause that will represent each fishbone:
public class FBCause
	{
		public FBCause()
		{
			SubCauses = new List();
		}
		public string Label { get; set; }
		public List SubCauses { get; set; }
	}
Next, we create the necessary fishbones this way:
var c1 = new FBCause { Label = "Measurements" };
c1.SubCauses = new List { "Inspectors", "Microscopes", "Calibration" };
…………
Once we are done with all fishbones, we create the model, which will serve as data source for the fdiag object:
var model = new List { c1, c2, c3, c4, c5, c6 };
III. Building the Diagram
Now that the data is ready, we can assign it to the ItemsSource property of the FishboneDiagram class:
fdiag.ItemsSource = model;
We will use the LabelPath and SubCausesPath properties to bind the respective fields of our FBClause objects to the correct data properties of FishboneDiagram:
fdiag.LabelPath = "Label";
fdiag.SubCausesPath = "SubCauses";
If the subclauses of your model were objects instead of strings as in our FBClause class you should use the SubLabelPath property to set the name of the field that will provide data for the subclause labels.
Finally we call the diagram’s ResizeToFitItems method to make sure all fishbones will be visible:
fdiag.ResizeToFitItems(30);
Compile and run the sample and you will see a perfect fishbone diagram.
That’s the end of our tutorial, you can download the sample together with all necessary dll-s from this link:
Download MindFusion Fishbone (Ishikawa) Diagram in WPF Sample
* The FishboneDiagram class will be officially released with the next version of the WPF Diagram Tool.
About Diagramming for WPF: This is the right tool to create flowcharts in WPF that always meet your requirements. The library offers more than 100 predefined node shapes, extensive event set and more than 15 exporters and importers. Each diagram that you build has a completely customizable look through styles, themes and appearance properties for each part of the flowchart. The numerous samples and detailed documentation help you learn quickly how to integrate the component into your own application. You can download the trial version, which has no feature restrictions and does not expire from the WPF Diagram Page on MindFusion website.