
In this post we will show how to use the JavaScript diagram library to create a lane diagram. The complete example is available here:
Create a new HTML page and add references to the jQuery library and to the MindFusion.Diagramming library:
<script src="jquery.min.js" type="text/javascript"></script>
<script src="MindFusion.Common.js" type="text/javascript"></script>
<script src="MindFusion.Diagramming.js" type="text/javascript"></script>
Create shortcuts to some classes from the diagram model:
var Events = MindFusion.Diagramming.Events;
var Diagram = MindFusion.Diagramming.Diagram;
var AnchorPattern = MindFusion.Diagramming.AnchorPattern;
var AnchorPoint = MindFusion.Diagramming.AnchorPoint;
var Alignment = MindFusion.Diagramming.Alignment;
var MarkStyle = MindFusion.Diagramming.MarkStyle;
var Style = MindFusion.Diagramming.Style;
var Theme = MindFusion.Diagramming.Theme;
var LinkShape = MindFusion.Diagramming.LinkShape;
var Shape = MindFusion.Diagramming.Shape;
var LaneGrid = MindFusion.Diagramming.Lanes.Grid;
var LaneHeader = MindFusion.Diagramming.Lanes.Header;
var LaneStyle = MindFusion.Diagramming.Lanes.Style;
var Rect = MindFusion.Drawing.Rect;
var Point = MindFusion.Drawing.Point;
var HandlesStyle = MindFusion.Diagramming.HandlesStyle;
Next, add a canvas the the page and create a diagram from it by using the Diagram.create() method:
diagram = Diagram.create($("#diagram")[0]);
You can obtain a reference to the diagram lane grid by calling the Diagram.getLaneGrid() method. You can use the returned object to add rows and columns to the grid and customize its appearance. Finally, to display the grid, call Diagram.setShowLaneGrid(). The customization is omitted here for brevity, but the full code is available in the associated sample project.
The lane grid implies some restrictions to the node and links inside of it. For example, the nodes can be moved only inside the row lanes of the grid. To enforce those restrictions, we will handle several diagram events:
diagram.addEventListener(Events.nodeCreated, onNodeCreated);
diagram.addEventListener(Events.nodeModified, onNodeModified);
diagram.addEventListener(Events.linkCreated, onLinkCreated);
In the nodeCreated event handler, get the gird cell at the top left of the node’s bounding rectangle and align the node to this cell:
function onNodeCreated(sender, e) {
    var node = e.getNode();
    node.setAnchorPattern(pattern);
    node.setHandlesStyle(HandlesStyle.HatchHandles3);

    // Place the box within the grid
    var bounds = node.getBounds();
    var topLeft = new Point(bounds.x, bounds.y);

    var cellBoundsReciever = {};
    if (!grid.getCellFromPoint(topLeft, cellBoundsReciever))
        return;
    var cellBounds = cellBoundsReciever.cellBounds;

    var pixel = 1;

    bounds.y = cellBounds.y + pixel;
    bounds.height = cellBounds.height - 2 * pixel;
    node.setBounds(bounds);
}
Similar rules can be applied to the links in the linkCreated event handler.
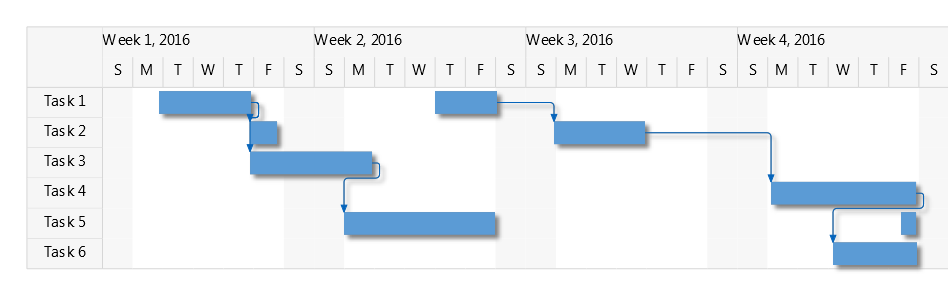
The following image illustrates the grid in action:
For more information on MindFusion JavaScript diagram library, see its help reference and overview page.
Enjoy!