
This is step-by-step tutorial on how to setup a JavaScript chart using MindFusion JS Chart library. In the sample here we will use a pie chart but the steps are applicable to any type of chart with small modifications.
The video for this tutorial is uploaded on YouTube at https://www.youtube.com/watch?v=kc1nNe4p770
I. The Web Page
Basically, our sample consists of an HTML file and a Scripts folder, which will hold all used *.js files. In the web page that will hold the control we add two JS references.
The first one is the config file:
<script type="text/javascript" src="Scripts/config.js">
We will define our chart in a PieChart.js file that we will place in the Scripts folder.
In the body of the file we create a div that holds a canvas.
The canvas renders the chart and we will access and use it in the JavaScript file. That’s why it is important that the canvas has an id.
II. Setup of the *.JS File
In the PieChart.js file we create a single method that will be responsible for building and customizing the chart:
define(["require", "exports", 'MindFusion.Charting'], function (require, exports, m) {
....
}
The first few lines define variables used to reference various chart namespaces:
var Charting = m.MindFusion.Charting;
var Controls = m.MindFusion.Charting.Controls;
var Collections = m.MindFusion.Charting.Collections;
var Drawing = m.MindFusion.Charting.Drawing;
III. General Chart Settings
We create the chart from the canvas in the HTML file.
var pieChart = new Controls.PieChart( document.getElementById('pieChart'));
Then we set a title for the chart and we increase the font size for the title:
pieChart.title = "Corporate Sales";
pieChart.theme.titleFontSize = 24;
IV. Series
The pie chart holds a single PieSeries.. For it we need data, inner and outer labels.
The data is a list with numbers:
var values = new Collections.List([20, 30, 10, 40, 35]);
The labels are a list with strings. Here is how we create the series:
pieChart.series = new Charting.PieSeries( values, null, new Collections.List(["a", "b", "c", "d", "e"]));
If you run the chart now you’ll see the pie with labels painted in a light green color.
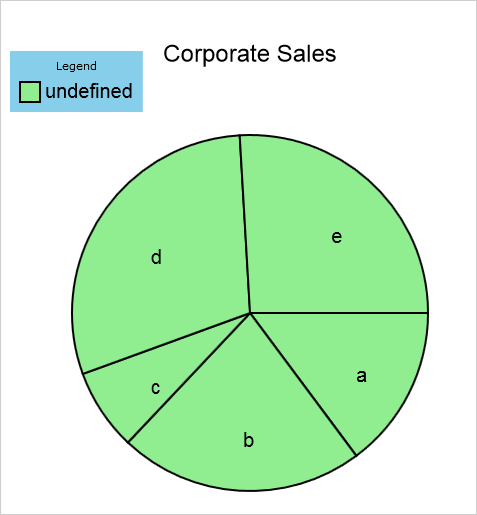
So, we need
V. Styling
The styling includes brushes for the pie pieces:
var brushes = new Collections.List([
new Drawing.Brush("#081b67"),
new Drawing.Brush("#cc2020"),
new Drawing.Brush("#7D7D7D"),
new Drawing.Brush("#67a6c7"),
new Drawing.Brush("#d0d0d0")
    ]);
var seriesBrushes = new Collections.List();
   seriesBrushes.add(brushes);
a single pie pen:
var pens = new Collections.List([
     new Drawing.Brush("#ffffff")
]);
var seriesPens = new Collections.List();
 seriesPens.add(pens);
a thickness for the pie pen:
var thicknesses = new Collections.List([
        15

]);

var seriesThicknesses = new Collections.List();
seriesThicknesses.add(thicknesses);
and a DashStyle for it:
var dashStyles = new Collections.List([
        Drawing.DashStyle.Solid
]);
var seriesDashStyles = new Collections.List();
  seriesDashStyles.add(dashStyles);
We could have set different pens, thicknesses and DashStyle for each pie piece, but we want all the pieces to be outlined with a single pen.
Note that those settings are of type array and are nested in another array. That is because the styling might apply to multi-series charts and each array is responsible for styling the elements of each series.
In our sample we style the pie chart with a PerElementSeriesStyle object, which we assign to the seriesStyle property:
pieChart.plot.seriesStyle = new Charting.PerElementSeriesStyle(seriesBrushes, seriesPens, seriesThicknesses, seriesDashStyles);
VI. Legend
The legend needs to be styled – the background, border and title need to be specified and customized to make it look better.
The legend title is a property of the chart.
pieChart.legendTitle = "Period";
The styling settings for a legend can be accessed through the theme property:
pieChart.theme.legendBackground = new Drawing.Brush("#ffffff");
pieChart.theme.legendBorderStroke = new Drawing.Brush("#cecece");
pieChart.theme.legendBorderStrokeThickness = 1.0;
pieChart.theme.legendTitleFontSize = 16;
The legend label is read from the title of each series in the chart. In our case we use:
pieChart.series.title = "2016";
With this our chart is complete. A hint: if you want to make the pie labels from inner to outer, you just need to change the position of the null value in the PieSeries constructor.
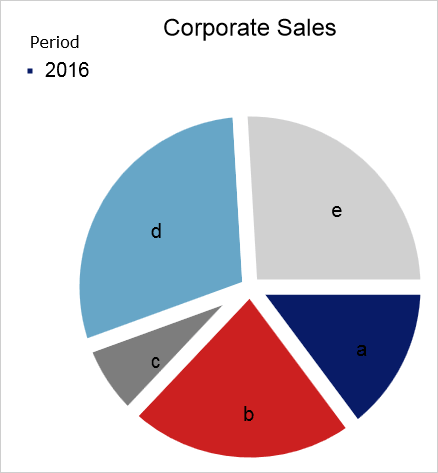
JS Pie Chart
MindFusion JS Chart is an interactive library for charts and gauges written purely in JavaScript. It supports all common chart types, multiple series, custom data,financial charts, a large selection of gauges and rich styling capabilities. The elegant architecture of the library allows you to create dashboards, charts with multiple different types of series in a single plot, unlimited number of axes, reusable styling themes, various oval and linear gauges. The innovative approach to data lets you define your own data classes by implementing a single interface.
The library also boasts a rich event set, zoom, pan, dragging of the legend and a set of many popular gauges. It is designed and implemented to provide JS developers with the perfect tool to create beautiful, interactive dashboards fast and easy. Download trial directly at http://mindfusion.eu/JavaScript.Chart.zip Get your license today at http://www.javascript-chart-buy.html