
In this tutorial we are going to build a report with nested data ranges. In our case, we are going to retrieve all categories from the sample Norhtwind database. For each category we will get all products in it, which is the nested data range.
I. Preparing the Project
We create a new WinForms project and add a new DataSet from the Nortwind database. We choose all fields from the Categories and Products tables. Then we add a new item from the menu “Project -> Add -> New Item -> MindFusion Report” from the dialog that appears.
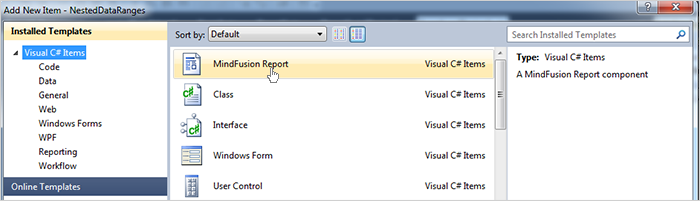
Adding the MindFusion Report item.
Drag and drop the nwindDataSet, CategoriesTableAdapter and ProductsTableAdapter on the report form. Finally, in the code behind fill the two adapters:
 productsTableAdapter1.Fill(nwindDataSet1.Products);
 categoriesTableAdapter1.Fill(nwindDataSet1.Categories);
II. The Categories DataRange
We create the first data range by right clicking on the newly created report. There we see “Create Data Range from Data Source”. We choose the categories table and two fields – CategoryName and Picture. When the data range is generated we resize the picture to make it bigger.
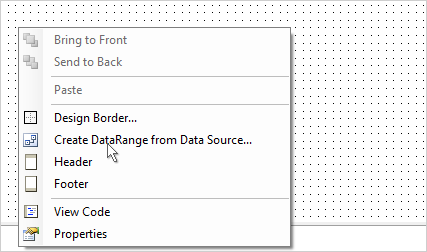
Create DataRange context menu.
III. Running the Report
We would use MindFusion ReportViewer to preview what we’ve done so far. We drag it from the Toolbox and place it on the form, which shows when the application runs. We compile the project and see that the Report1 class that we’ve created appears in the Toolbox, under the Data tab. This means we can create instances of our report just by drag and drop. We drag the Report1 icon and drop it on Form1. We have a report11 instance, which we assign to the Report property of the ReportView in the property grid.
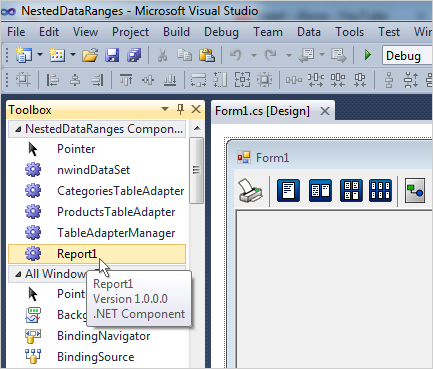
Dragging the Report1 item.
Finally, we run the report:
report11.Run();
IV. The Nested DataRange
It’s time to create the second DataRange. We right-click the Report1 form and choose again “Create DataRange from Data Source.” This time we choose the Products table and we choose ProductName, UnitsInStock and UnitPrice fields. This time we check the “Generate Header” checkbox at the bottom. The second DataRange is ready. Nesting it is very easy. We resize the first DataRange to make it wider and just drag and drop the second DataRange in it. What is important is to set the MasterDetailRelation property. It must be the name of the relation between the two tables that provide data for the two DataRange-s. We can see it by clicking on the nwindDataSet -> “Edit DataSet with Designer. There we click on the relation between or two tables and see it is called “CategoriesProducts”. We place this name as a value to the MasterDetailRelation property.
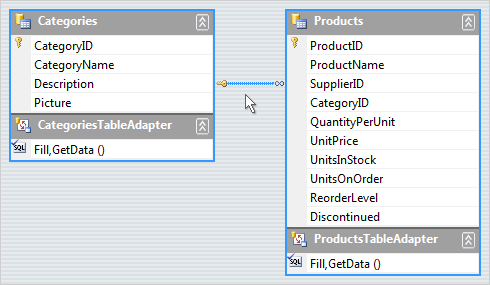
Master detail relationship between the Products and Categories table.
V. Run the report
We run the report and see that everything is in place: the categories are listed with their picture, each category lists all its products.
VI. Style Adjustments
Finally let’s add some appearance optimizations that will make the report look better and thus be easier to read. First, we make the background of the Category label darker.
Then we make the product lines with alternating colors. This is done in the property grid for the dataRange2 object -> AlternatingBackground property.
We add a light gray border to the first data range with the Border property editor and we add a bottom margin of 30 mm. Here is the final look of the report:

Nested DataRange-s: the final report.
You can download the sample from this link:
Download Nested DataRanges MindFusion Reporting Sample
More about MindFusion Reporting for WinForms component can be found here.