
In this post we will explore how to create a bar chart that shows the weekly working hours for each
member of a team. We use MindFusion.Charting for WinForms component.
The Type of the Bar Chart
We decide to use a horizontal bar chart, which will give a clear visual representation of the data in this case. We use the BarType property to choose the bar type and set the Horizontal property:
barChart1.Horizontal = true;

barChart1.BarType = MindFusion.Charting.BarType.Single3D;
A 3D chart would look more sophisticated so we choose “Single3D” for a BarType.
The Data
We don’t need to set data for both axes – one is enough. The control automatically sets values for the
other axis to make the bars equally distributed. We can write the data by hand or use the built-in
design time collection editor:
barChart1.Data.Add(new List() { 82, 60, 73, 45, 19, 34, 58, 23, 69, 17 });
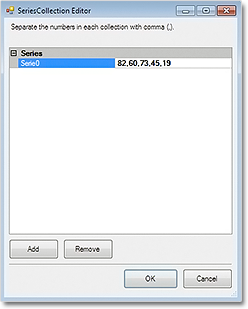
The data collection editor
The Axes
The X-axis shows a scale of the total working hours for the week. We set its LabelType to “AutoScale”
and set the interval to 10:
barChart1.XAxisSettings.LabelType = MindFusion.Charting.AxisLabelType.AutoScale;

barChart1.XAxisSettings.AxisDelta = 10;
This is the only axis that shows numbers on the chart, so we show the starting zero number:
barChart1.XAxisSettings.DrawZero = true;
We want to show whole numbers at the axis – no decimal fractions – and we use the NumberFormat property to set this:
barChart1.XAxisSettings.NumberFormat = MindFusion.Charting.NumberFormat.Fixed_point_0Digits;
Finally, we set the title:
barChart1.XAxisSettings.TitleLabel = "Total Weekly Hours";
For the Y-axis we want to show custom labels – the name of each employee. We use the YLabels property to specify the labels and set YAxisSettings.LabelType to the appropriate value:
barChart1.YAxisSettings.LabelType = MindFusion.Charting.AxisLabelType.CustomText;

barChart1.YLabels.Add(new List() { "Mary Johnson", "Tim Davidson", "Alan  Hank", "Elisa Labate", "Boris Foster", "Tim Carnes", "Olivia Beverling", "Mark Buchanan", "Ron Callary", "Cindy Peterson" });
The Grid
A vertical grid will help us identify the value of each bar. The GridType property, together with the
GridBrush and AltGridBrush help use set the type and colors of the grid. We outline the plot area with PlotAreaOutline:
GridType = MindFusion.Charting.GridType.VertScale;

barChart1.GridBrush = new MindFusion.Drawing.SolidBrush(Color.White);

barChart1.AltGridBrush = new MindFusion.Drawing.SolidBrush(Color.FromArgb(240, 240, 240));

PlotAreaOutlinePen = new MindFusion.Drawing.Pen(Color.FromArgb(220, 220, 220));
The Bar Colors
We use ChartBrushes and ChartPens to specify how our bars will be colored. Here is the final chart:
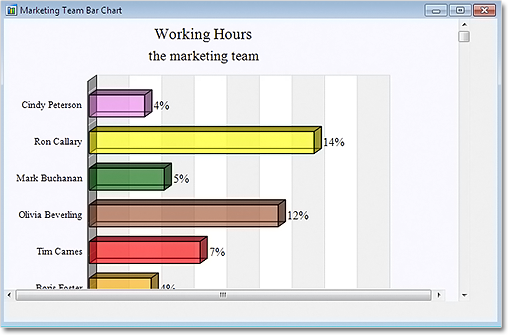
3D BarChart in .NET WinForms
Scrolling the chart:
We set the ResizeType to “Scrollable“. This way we can scroll to see all data on the chart without the need to increase the size of the chart and let it take too much space.
barChart1.ResizeType = MindFusion.Charting.WinForms.ResizeType.Scrollable;
The sample is available for download from here:
Download WinForms Working Hours Bar Chart Sample
A trial version of MindFusion.Charting for WinForms is available from here: