
The new release of Diagramming for Silverlight provides two new layouts and a few other new features. Here is an overview:
Tree map layout
Tree maps represent hierarchies by nesting child nodes within their parents, where the areas of leaf nodes are proportional to their Weight values. Unlike other layout algorithms, TreeMapLayout expects hierarchies to be defined via grouping or containment (see AttachTo method and ContainerNode class), and will ignore any links in the diagram. The diagram area covered by the topmost nodes in a hierarchy is specified via the LayoutArea property. By default, the layout tries to keep the ratio of node sides as close as possible to one.
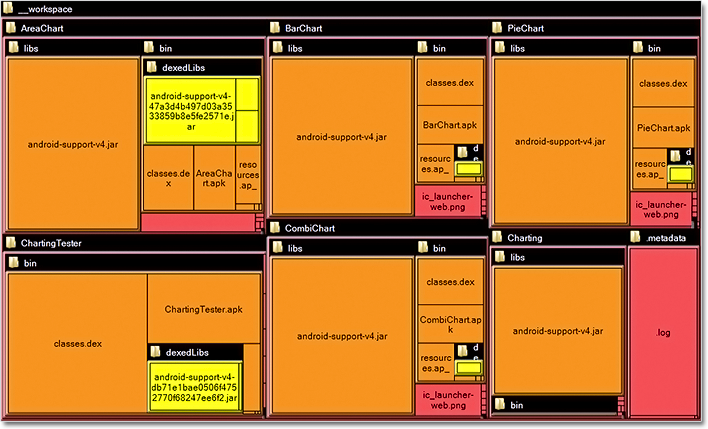
The tree map layout.
Decision flowchart layout
DecisionLayout arranges simple flowcharts consisting of decision boxes with up to three outgoing links per node and activity boxes with a single outgoing link per node. The nodes are arranged in columns and rows, whose distance depends on the HorizontalPadding and VerticalPadding property values. When links share the same row or column, they are placed at a distance specified via LinkPadding. The layout arranges nodes recursively starting from StartNode.
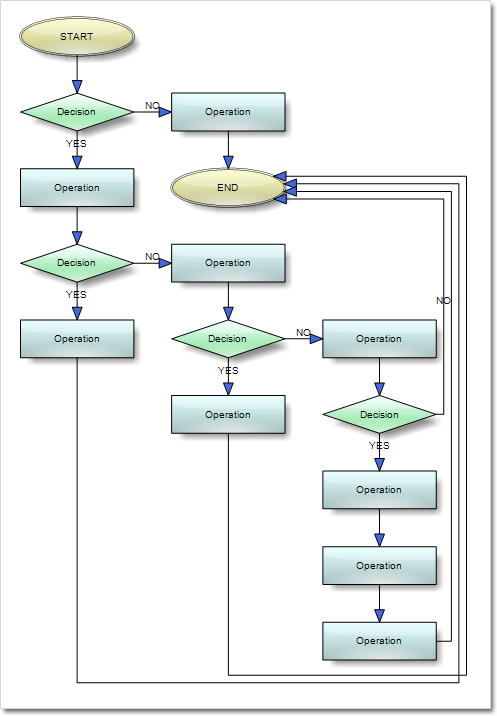
The decision layout.
Miscellaneous
~ Layout algorithms now automatically resize diagram’s Bounds if it’s not large enough to fit the arranged content.
~ LinkLabels are now copied by DiagramLink copy constructor and clipboard methods.
~ ContainerNode now displays a caption bar when its Shape is set to Rectangle or RoundRect.
You can download the trial version directly from the link below:
Download DiagramLite 3.0.1 Trial Version
Feel free to contact us with any questions about Diagramming for Silverlight or any other of our products – please use the forum, email support@mindfusion.eu or the help desk. We strive to provide competent and detailed answers to all support inquiries within hours of receiving them.
About MindFusion.Diagramming for Silverlight: A programming component specially designed and developed to provide web developers with a fast and easy way to create diagrams, graphs, schemes, hierarchies, charts and many more. The impressive feature set of the control ranges from predefined node shapes to custom nodes and thirteen automatic layouts. The style and appearance of all diagram elements are completely customizable, the numerous samples provide programmers with plenty of example code to look from.
The control boasts intuitive API that is documented in details in the help file provided with the installation. There are also step-by-step tutorials and various guides. You can check the features
list here to find out more about the
capabilities of the tool. An online demo is also available. The prices are per developer, source code is also available. Learn more about the licensing scheme here.