
In today’s post we’ll show how to build a line chart with several line series and a separator line. The separator line is drawn at a given height and divides the chart into two halves.
The Line Series
The line series are three, so we must add three lists with data to the XData and YData properties. We can do this in three ways: type the values in design time, write them in code or use data binding. In design time we use the built-in collection editors of the control:
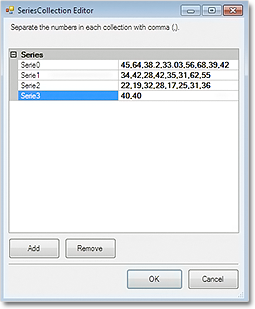
The Series collection editor
In code we make lists with the data and add them to XData or YData:
lineChart1.YData.Clear();
lineChart1.YData.Add(new List { 45, 64, 38.2, 33.03, 56, 68, 39, 42 });
lineChart1.YData.Add(new List { 34, 42, 28, 42, 35, 31, 62, 55 });
lineChart1.YData.Add(new List { 22, 19, 32, 28, 17, 25, 31, 36 });
If you want to use data binding then set DataSource to the name of the data source, DataMember to specify the name of the table which will supply the data and XDataFields/YDataFields to provide the name(s) of the fields. In this case we will require three data base columns for each of the three series – separate the names with a comma e.g.
lineChart1.YDataFields = "Sales1,Sales2,Sales3";
For XData we use the same list because we want the series to appear exactly under each other:
lineChart1.XData.Clear();
lineChart1.XData.Add(new List { 10, 20, 30, 40, 50, 60, 70, 80 });
lineChart1.XData.Add(new List { 10, 20, 30, 40, 50, 60, 70, 80 });
lineChart1.XData.Add(new List { 10, 20, 30, 40, 50, 60, 70, 80 });
The Series
We set LineType to Line and Scatter because we want to show scatters at data points:
lineChart1.LineType = MindFusion.Charting.LineTypes.Line |
MindFusion.Charting.LineTypes.Scatter;
The LineTypes enumeration allows bit wise combining of its members. We use ChartPens to set the pens for the line series. ShapesPens and ShapeBrushes set the pens for the outline and the brushes for filling the scatters:
lineChart1.ChartPens.Add(new MindFusion.Drawing.Pen(Color.FromArgb(102, 205, 170), 6));
lineChart1.ShapePens.Add(new MindFusion.Drawing.Pen(Color.FromArgb(102, 205, 170), 2));
The pens for the series are thicker than the pens for the scatters. The fill brush is slightly lighter:
lineChart1.ShapeBrushes.Add(new MindFusion.Drawing.SolidBrush(Color.FromArgb(175, 251, 175)));
Finally – we set the size of the shapes and their type:
lineChart1.Shapes.Add(MindFusion.Charting.Shape.Circle);
lineChart1.ShapeSizes.Add(10);
The Separator
There are two ways to draw the separator line.
The first is to add a custom summary value. In this case the separator line will be drawn from the
smallest X-data value to the biggest one, parallel to the axes.
lineChart1.AddCustomSummary(40.0, "");
The summary line is drawn with shapes at both ends, but we can hide them by setting their size to 0:
lineChart1.SummaryBrushes.Add(new MindFusion.Drawing.SolidBrush(Color.Gray));
lineChart1.SummaryShapeSizes.Add(0);
The second way to draw the separator line is to add it as a 4th series in the XData and YData lists and add a pen for it in the ChartPens list. The advantage is that we can make the line as long as we want, in our case – as long as the length of the X-axis:
lineChart1.XData.Add(new List { 0, 90 });
The Legend
We use LegendLabels to add the labels for the line series:
lineChart1.LegendLabels = new List() { "2010", "2011", "2012" };
We set the background of the legend, but we don’t have to add any brushes or shapes for the legend items – they are taken automatically from the line series settings:
lineChart1.LegendBackgroundBrush = new MindFusion.Drawing.SolidBrush(Color.FromArgb(253, 253,
253));
The Grid
The GridType is GridType.HorScale. We use GridBrush, AltGridBrush and GridPen to set the colors for the grid.
lineChart1.GridPen = new MindFusion.Drawing.Pen(Color.FromArgb(200, 200, 200));
lineChart1.GridPen.DashStyle = System.Drawing.Drawing2D.DashStyle.Dash;
lineChart1.GridType = MindFusion.Charting.GridType.HorScale;
If you make the changes to the chart in code, don’t forget to call UpdateChart() to make sure the
control knows changes have happened and the chart must be updated.
Here is the final chart:
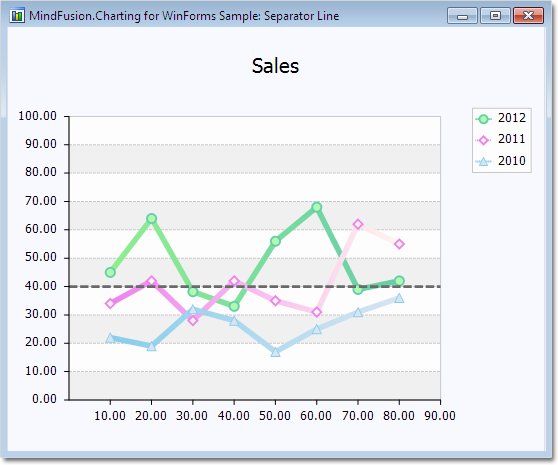
A line chart with a separator line.
The sample is available for download from here:
Download Line Chart with Separator Line Sample
You can download the trial version of the component with extensive documentation and many other samples from here: