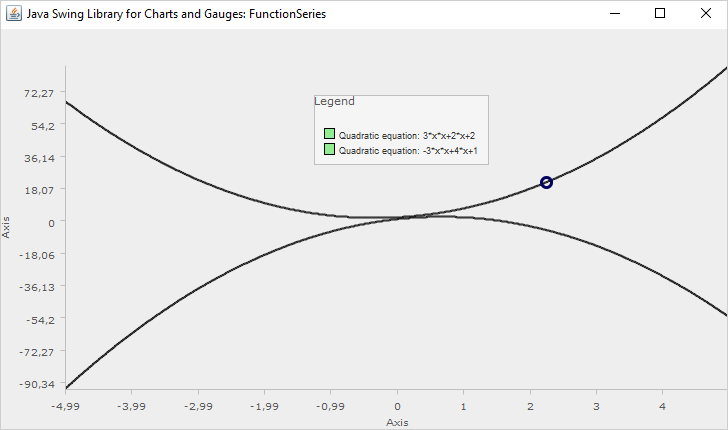
In this blog post we will build the chart that you see in the image below:

The next sections present you with a step-by-step guide how to build this quadratic equations chart from scratch.
I. Project Setup
Create a new Java Project in your preferred Java IDe and in the project folder copy the JChart.jar file. This is the *.jar archive that contains the library. In our sample we’ve copied it in a new subfolder, which we have called “libs”. The JChart.jar is found in the downloadable archive for the trial version of MindFusion Charting for Java Swing. This is the link to download it: https://mindfusion.eu/JChart.zip.
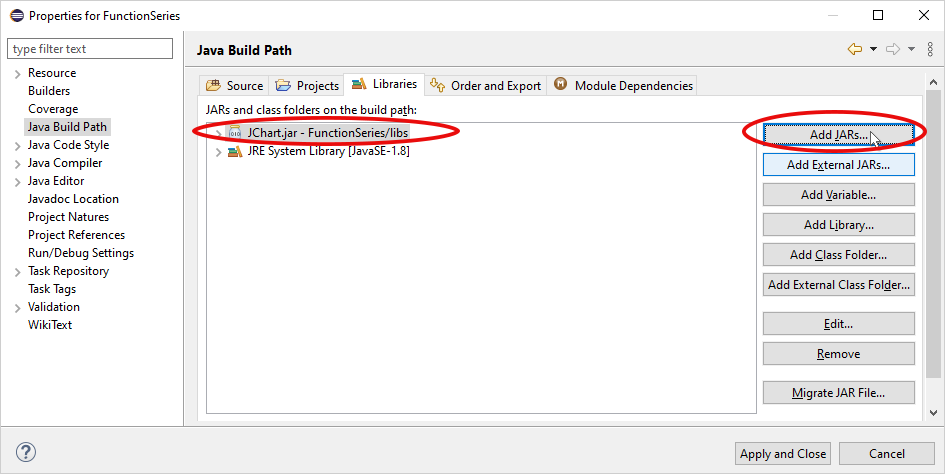
We need to include the JChart.jar in the build path of our chart application. In Eclipse we do this by right-clicking on the project root folder and choosing “Properties->Java Build Path->Add JARs” and then navigate to the location of JChart.lib in your project folder:

Then we create a new class, which we call MainWindow and make it extend JFrame. This will be the only class of our application and it will start it:
public class MainWindow extends JFrame
{
   private static final long serialVersionUID = 1L;

  //the main method of the application
   public static void main(String[] args)
   {
     	SwingUtilities.invokeLater(new Runnable()
	{
	     public void run()
	     {
		try
		{
		   new MainWindow().setVisible(true);
		}
		catch (Exception exp)
		{
		}
	  }
	});
    }
}
We import the namespaces that we are going to use: they are for the chart but also standard AWT and Swing namespaces:
import java.awt.BorderLayout;
import java.awt.Color;
import java.util.Arrays;

import javax.swing.JFrame;
import javax.swing.SwingUtilities;

import com.mindfusion.charting.FunctionSeries;
import com.mindfusion.charting.GridType;
import com.mindfusion.charting.swing.LineChart;
import com.mindfusion.drawing.Brushes;
import com.mindfusion.drawing.DashStyle;
import com.mindfusion.drawing.SolidBrush;
With that done, we are ready to create the chart.
II. The Line Chart
We create the LineChart is a separate method, which we will call from the constructor of the main class.
private LineChart initializeChart()
{
	LineChart lineChart = new LineChart();
        ..................
        ..................
        return lineChart;
}
The graphs of the math functions that we want to render will be drawn by means of the FunctionSeries class. Its constructor takes as a string the mathematical expression that defines the function equation. Then it parses it by means of the MindFusion.Scripting library, which is included in JChart. In our case we create two FunctionSeries, which use two different quadratic equations:
FunctionSeries series1;
FunctionSeries series2;

	try
	{

		series1 = new FunctionSeries(
			"3*x*x+2*x+2", 1000, -5, 5 );
		series1.setTitle("Quadratic equation: 3*x*x+2*x+2");
		lineChart.getSeries().add(series1);

		//mean value is -2
		series2 = new FunctionSeries(
			"-3*x*x+4*x+1", 1000, -5, 5);
		series2.setTitle("Quadratic equation: -3*x*x+4*x+1");
		lineChart.getSeries().add(series2);

	}
	catch (Exception e)
	{
		// could not parse the expression
		e.printStackTrace();
	}
Note that the constructor of the FunctionSeries is enclosed in a try-catch block. This is done is case the equation cannot be parsed. In this case the exception is printed in order to provide information about the error.
The other parameters provided to the FunctionSeries constructor are: 1. the number of points to be calculated for the function graph; 2. The start of the interval of calculations; 3. The end of the interval of calculations. The calculations include the start and end values.
Next we get the ContentPane for the JFrame and add the LineChart to it, stretched on its entire work area, using the BorderLayout:
protected MainWindow()
{
	setDefaultCloseOperation(EXIT_ON_CLOSE);
	setSize(650, 400);
	setTitle("Java Swing Library for Charts and Gauges: FunctionSeries");
	//add the chart to the ContentPane
	getContentPane().add(initializeChart(), BorderLayout.CENTER);
}
Now if we run the sample we will be able to see the graphics of the chart, albeit without styling:

We will use the numerous styling capabilities of the Java Chart library to make the chart visually appealing.
III. Styling the Chart
We use first the getXAxis and getYAxis methods to gain access to the two major axes of the chart and style them.
lineChart.getXAxis().setMinValue(-5.0);
lineChart.getXAxis().setMaxValue(5.0);
lineChart.getXAxis().setInterval(0.5);
lineChart.getXAxis().setOrigin(0.0);
lineChart.getXAxis().setTitle("X-axis");

lineChart.getYAxis().setMaxValue(30.0);
lineChart.getYAxis().setMinValue(-30.0);
lineChart.getYAxis().setTitle("Y-axis");
We use the setMinValue and setMaxValue methods to specify the two ends of the axis. If we don’t explicitely specify the interval with setInterval, the chart will calculate it so that exactly 10 intervals would fit between min and max. We also use setTitle to specify how the axes are called.
Then we specify the GridType of the chart and the stroke which is used when rendering the grid. We want crossed grid:
//styling the grid
lineChart.setGridType(GridType.Crossed);
lineChart.getTheme().setGridLineColor(new Color(192, 192, 192));
lineChart.getTheme().setGridLineStyle(DashStyle.Dot);
The legend renders by defaut with legend labels taken from the Title of the chart’s Series instances. We would like to hide the title of the legend and increase the font of the legend labels. The properties are ShowTitle of LegendRenderer and DataLabelsFontSize .
lineChart.getLegendRenderer().setShowTitle(false);
lineChart.getTheme().setDataLabelsFontSize(12);
Finally, we need to set the colors of the chart series. There is a variety of styles to choose from, but in our case we need a simple coloring of each series with a single-color stroke. We use the CommonSeriesStrokes and CommonSeriesStrokeThicknesses to specify the color and thickness of the graph lines. We also set CommonSeriesFills to use the same set of brushes as the strokes. We do not need them by chart rendering, but they are used by the legend to draw the color squares before the series titles:
lineChart.getTheme().setHighlightStroke(Brushes.Orange);
lineChart.getTheme().setCommonSeriesStrokes(
		Arrays.asList(
			new SolidBrush( new Color (90, 116, 68 )),
			new SolidBrush( new Color (70, 105, 125))));
lineChart.getTheme().setCommonSeriesFills(
		Arrays.asList(
			new SolidBrush( new Color (90, 116, 68 )),
			new SolidBrush( new Color (70, 105, 125))));
lineChart.getTheme().setCommonSeriesStrokeThicknesses(
			Arrays.asList(3.0));
And these were the final lines of code for our chart application. We now have a beautiful quadratic functions chart. Here is the complete project source code, together with the trial version of the JChart.jar:
Quadratic Equations Graph in Java Swing: Download Full Source Code
For technical support, please use the discussion board for the charting library for Java Swing at https://mindfusion.eu/Forum/YaBB.pl?board=jchart_dic
About MindFusion Chart & Gauge Library for Java Swing: This is a native Java Swing library suitable for drawing numerous chart and gauge types. The flexible API allows combination of the various chart parts: axes, plots and series, to create unique charts suitable for the specific needs of any business application: charts with multiple plots, axes at all sides, different chart graphics in one plot and more. All chart series descend from a basic Series interface, which can be implemented by the programmer to create their own Series classes. The appearance is controlled by themes, with aspect of the chart looks being customizable. The gauge library is part of the chart control and offers a set of oval and linear gauge, which can be used to create any type of gauge circular or rectangular gauge with up to three measure scales. The library comes with a set of predefined popular gauges: compass, clock, thermometer and more. Learn further details about MindFusion Charts and Gauges for Java Swing at: https://mindfusion.eu/java-chart.html.
