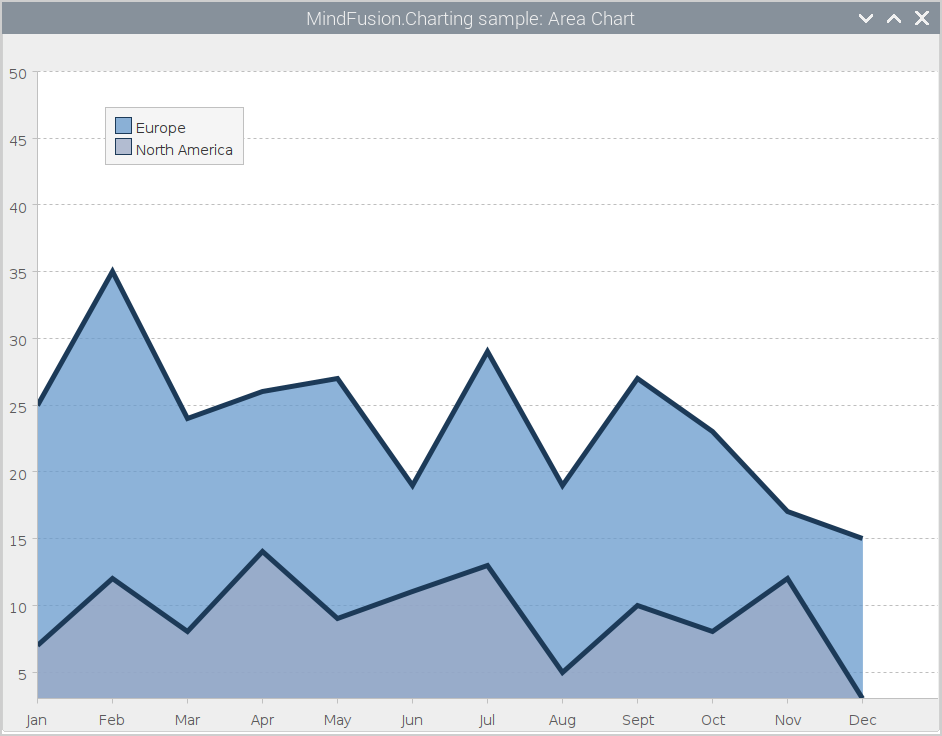
In this blog post we are going to show you how to build this beautiful area chart with two series. We use MindFusion charting library for Java Swing and the AreaChart control that is part of it.
I. General Setup
We use IntelliJ Idea as the IDE for developing the chart application. You can use any other IDE, the menus may differ, but the steps are the same.
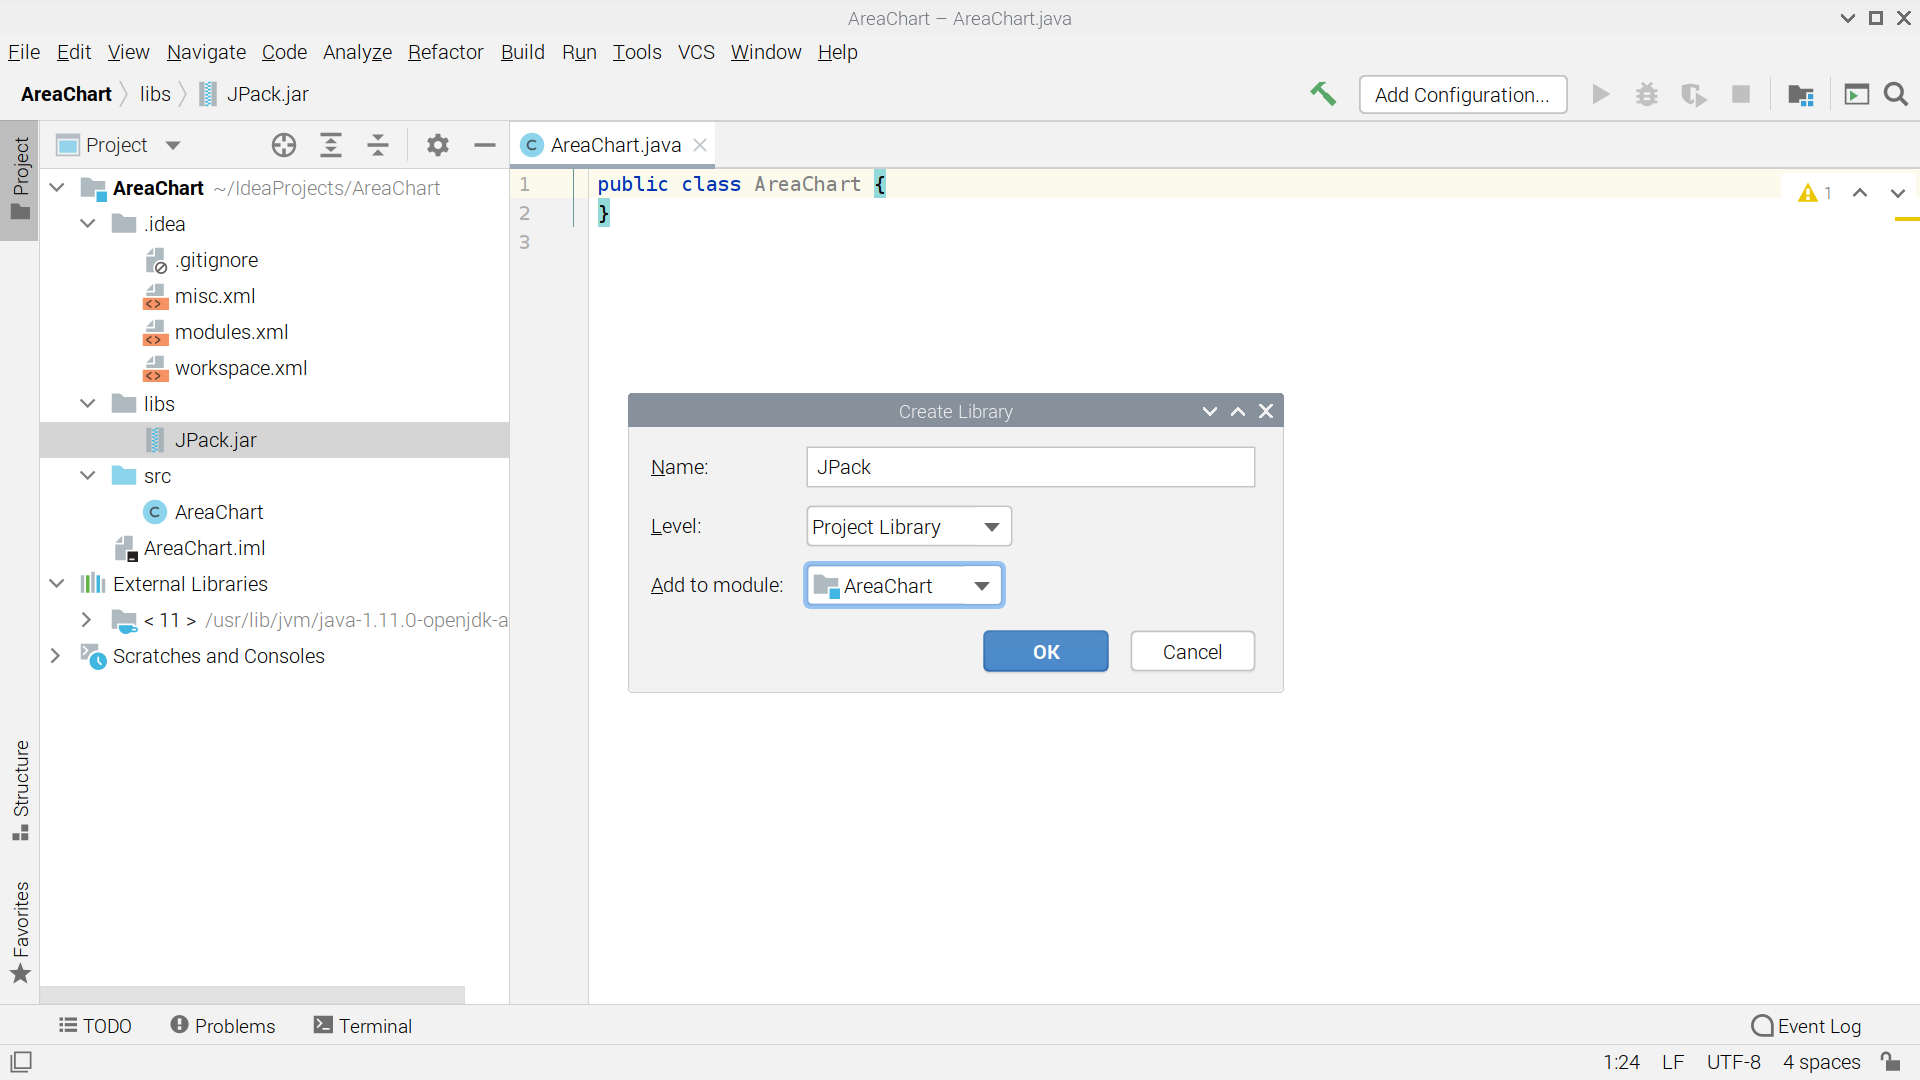
First, we create a new project and add a folder called libs to it. There we copy the JPack.jar archive, which contains all MindFusion controls from the Pack for Java Swing collection. You don’t have to use the jar archive for the pack, you can use just the jar with the charting control, which you can download from https://mindfusion.eu/java-chart.html.
After we copy the archive, we right click on it and select “Add as library” from the context menu. The IDE will add the jar file to the build path of the project. When asked where do you want to have the jar added to, make sure you specify the whole project:
After that we create a new class, which we call AreaChart and make it extend JFrame. This will be the main and only class of our application. In its main method we add the default Java code for creating and starting a window. Then, we create a new instance of the AreaChart class:
public class AreaChart extends JFrame
    {
        public static void main(String[] args) {
            JFrame f = new JFrame();
            f.setTitle("MindFusion.Charting sample: Area Chart");
            f.setSize(800, 600);
            f.setDefaultCloseOperation(JFrame.EXIT_ON_CLOSE);

            com.mindfusion.charting.swing.AreaChart chart =
                    new com.mindfusion.charting.swing.AreaChart();

	    f.getContentPane().setLayout(new BorderLayout());
            f.getContentPane().add(chart, BorderLayout.CENTER);

            f.setVisible(true);

}
II. Chart Data and Series
The data for the chart is specified with two instances of the Series2D class. This class takes as parameters in the constructor three lists: array with data for the X-coordinates of data points, array with data for the Y-coordinates of data points and a list with the labels. The list with the labels can be null.
// create sample data series
Series2D series1 = new Series2D(
      Arrays.asList(0.0, 1.0, 2.0, 3.0, 4.0, 5.0, 6.0, 7.0, 8.0, 9.0, 10.0, 11.0),
      Arrays.asList(25.0, 35.0, 24.0, 26.0, 27.0, 19.0, 29.0, 19.0, 27.0, 23.0, 17.0, 15.0),
labels);
The labels list is defined this way:
Listlabels = Arrays.asList( "Jan", "Feb", "Mar", "Apr", "May", "Jun", "Jul", "Aug", "Sept", "Oct", "Nov", "Dec" ); We do not want the labels to appear at data points, which is the default way of rendering these labels. Luckily, the Series2D class exposes a method called setSupportedLabels which allows us to specify where these labels should be applied. The paramter of this method is an instance of the LabelKinds enumeration, which exposes members for all type of labels that can be found on a chart. The members allow bitwise combining. In our case we want to render the labels at the X-axis. So, we set them in this simple way:series1.setSupportedLabels(LabelKinds.XAxisLabel);We also have to specify a title for our series with the setTitle method. The title is rendered as an item for the series in the legend. We will show legend on our chart, so we need to specify the label that corresponds to this series.
Finally, we must add this Series2D to the collection of Series for the chart. We use getSeries to get the collection and add the newly-created series:
chart.getSeries().add(series1);The second series differs to the first one only in the Y-data. It also doesn't have labels. We don't need two lists of labels at the X-axis - one is enough.
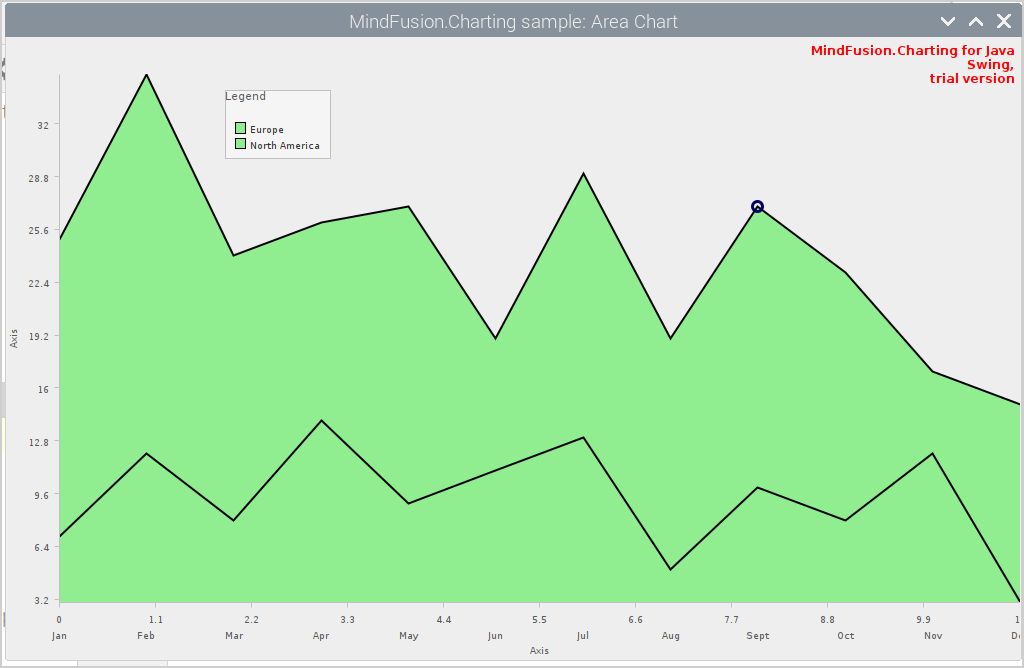
With that setting of the data is finished and we can run the appliation to see our chart:
The chart is correct but doesn't look very attractive. We need to style it.
III. Chart Styling
We fine-tune the appearance of the chart axes with the methods of the Axis class. The Axis objects, responsible for the two axes are accessed with the getXAxis and getYAxis methods. We use the setMaxValue and setInterval methods to adjust the intervals of both axes. This has effect on the max value as well. We also use setTitle to hide the axis title - we specify an empty string.
chart.getYAxis().setInterval(5.0); chart.getYAxis().setMaxValue(50.0); chart.getXAxis().setMaxValue(12.0); chart.getXAxis().setInterval(1.0); chart.getXAxis().setTitle(""); chart.getYAxis().setTitle("");Then we customize the grid. We want horizontal grid with dashed lines. We use the "Horizontal" member of the GridType enumeration. It is provided as an argument to the setGridType method of chart. We specify the dashed lines with setGridLineStyle and use setGridLineColor to specify color for the grid lines.
chart.setGridType(GridType.Horizontal); chart.getTheme().setGridLineColor(new Color(190, 190, 190)); chart.getTheme().setGridLineStyle(DashStyle.Dash);We need to adjust the size of the font for the chart labels as well:
chart.setShowXCoordinates(false); chart.getTheme().setAxisLabelsFontSize(14); chart.getTheme().setDataLabelsFontSize(14);The chart has many properties for customizing all types of font used on it. They are members of the Theme class. Each chart type has a Theme object in it, it is accessible through getTheme
Finally, we need to think about the colors of the area graphics. We will use the setCommonSeriesFills method of Theme to specify the colors for each Series. The commonSeriesFills and strokes properties specify lists with brushes that color the inside and the contour of each series.
chart.getTheme().setCommonSeriesFills( Arrays.asList( new SolidBrush( new Color (102, 154, 204, 190)), new SolidBrush(new Color (156, 170, 198, 190)))); chart.getTheme().setCommonSeriesStrokes( Arrays.asList( new SolidBrush( new Color (28, 58, 88)))); chart.getTheme().setCommonSeriesStrokeThicknesses( Arrays.asList(5.0));And these are the last customizations on our AreaChart. The final chart is ready.
You can download the full source code of the sample from this link:
Area Chart in Java Swing: Download Full Source Code
For technical support, please use the discussion board for the charting library for Java Swing at https://mindfusion.eu/Forum/YaBB.pl?board=jchart_dic
About MindFusion Chart & Gauge Library for Java Swing: This is a native Java Swing library suitable for drawing numerous chart and gauge types. The flexible API allows combination of the various chart parts: axes, plots and series, to create unique charts suitable for the specific needs of any business application: charts with multiple plots, axes at all sides, different chart graphics in one plot and more. All chart series descend from a basic Series interface, which can be implemented by the programmer to create their own Series classes. The appearance is controlled by themes, with aspect of the chart looks being customizable. The gauge library is part of the chart control and offers a set of oval and linear gauge, which can be used to create any type of gauge circular or rectangular gauge with up to three measure scales. The library comes with a set of predefined popular gauges: compass, clock, thermometer and more. Learn further details about MindFusion Charts and Gauges for Java Swing at: https://mindfusion.eu/java-chart.html.