
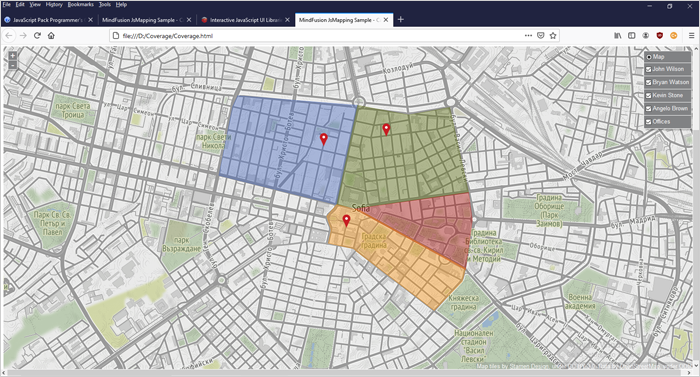
In this blog post we are going to use the CanvasLayer of the JavaScript map library to build a web page that renders a city map with overlay polygons of the districts, covered by various couriers of a company. Each area is a separate in different color. Here is the final result:
I. General Setup
We start with an empty web page where we add the references to the mapping JavaScript file and the other files that contain Utility classes used by the mapping library:
<script src="Scripts/MindFusion.Common.js"
type="text/javascript"></script> <script
src="Scripts/jscommon.js" type="text/javascript"></script>
<script src="Scripts/jscollections.js"
type="text/javascript"></script> <script
src="Scripts/MindFusion.Mapping.js"
type="text/javascript"></script>
In the HEAD section of the web page we add references to the CSS themes that are available for the mapping library:
<div style="top: 70px; bottom: 24px;">
		<div style="position: absolute; width: 100%; height:
100%;"> <div id="mapView" style="height: 100%; width: 100%;">
			</div>
		</div>
	</div>
II. The MapView and the MapLayer
Each map created by MindFusion mapping library is represented by a MapView and a MapLayer. The MapView class requires a reference to an HTML Element and we use the DIV, which we initialized in the web page as a parameter. Once we’ve created the view, we can customize its looks by assigning a given theme to it. The name of each theme corresponds to the name of the CSS file where its settings are stored. We use the standard theme in our map:
// create a new instance of the mapView
var view = new m.MapView(document.getElementById("mapView"));
view.theme = "standard";
The map tiles are provided by Tile Mapping Service. There are both free and paid options of TMS servers. In our sample we use the maps provided by stamen.com and credit them accordingly. The MapLayer has a special property called attribution where you place the URL and credit of the map tile provider, if needed.
var l = new m.MapLayer("Map");

l.urlTemplate = "http://d.tile.stamen.com/terrain/{z}/{x}/{y}.png";
l.attribution = 'Map tiles by Stamen
Design, under CC BY 3.0. Data
by OpenStreetMap, under ODbL.';
view.layers.add(l);
After we’ve created the MapLayer we add it to the layers collection of the MapView.
III. CanvasLayer Instances
The CanvasLayer is the layer that can hold polygon or circle drawings. Both type of drawings support fill and stroke, which is how we can make the polygons semi-transparent. The Poly constructor requires a list with the points that build the figure. The figure can be closed and smooth . In our case we want a closed figure but turn the smooth option off. We also have the option to specify strokeThickness . Note that the thickness is provided in meters e.g. it will change with the zoom ratio of the map. Here is a sample list with points for one of the area regions:
//John Wilson
var points = [
    new m.LatLong(42.70475564699256, 23.31153304748534),
    new m.LatLong(42.70557559570199, 23.3120480316162),
    new m.LatLong(42.70488179365276, 23.32380683593749),
    new m.LatLong(42.69773045026787, 23.32174689941405),
    new m.LatLong(42.699835727309186, 23.310202671813954)];
We create then a new CanvasLayer and add it to the layers
property of the MapView :
var drawings = new m.CanvasLayer("John Wilson");
view.layers.add(drawings);
The name of the layer, which we provide in the constructor will render in the map layers legend: if we do not turn it off. Then we need to create the Poly instance using the points array. Once we have customized it we need to add it to the decorations collection of the CanvasLayer. It is important to note that the drawing is a decoration, not a direct part of the layer itself.
// create a smooth polyline connecting the points
var poly = new m.Poly(points);
poly.stroke = "#4164BE";
poly.fill = "rgba(65, 100, 190, 0.4)";
// stroke thickness in meters
poly.strokeThickness = 2;
poly.strokeDashStyle = d.DashStyle.Solid;
poly.smooth = false;
poly.closed = true;
drawings.decorations.add(poly);
With that ready, we can see the polygon rendering over the terrain map. Once we are finished initializing the CanvasLayer instances, we can set the active layer of the view and specify the point that will render when it loads. Note: you should specify the point that renders in the center when the page loads only after you’ve finished all other initialization and customization of the map:
// set the topmost map layer
view.activeLayer = view.mapLayers.items()[0];

// load all layers
view.load(new m.LatLong(42.69743870212541, 23.3230343597412), 15);
And with that we have finished building our map. You can run the sample from this link:
You can download the full source code with all libraries used from this link:
Coverage Map in JavaScript: Download the Sample
Technical support is available at MindFusion forum at https://mindfusion.eu/Forum/YaBB.pl
About MindFusion Mapping for JavaScript: The mapping library is written in pure JavaScript and supports a rich API for creating and customizing any type of map. The component requires a Tile Map Service (TMS) as a provider for the map. There is a special property to credit the TMS providers, if you need to.
Mapping for JavaScript supports unlimited number of map layers. The layers can hold pins, labels, markers, image icons, annotations or polygons. They can be turned on or off. The appearance of the map UI is specified through themes. Each map supports zoom and pan. Find out more about Mapping for JavaScript at https://mindfusion.eu/javascript-map.html.