Chart and Dashboard Elements
MindFusion.Charting for Java Swing library lets you build charts and dashboards by combining various kinds of elements in a hierarchy of Component objects. The main types are:
In addition, you can use TextComponent, ImageComponent and BorderComponent to add decorative elements to a Dashboard, such as chart title or company logo.
Plot components can display multiple SeriesRenderer instances for matching coordinate system types. For example, you can mix bar and line graphics in 2D Cartesian system by adding a LineRenderer and a BarRenderer to a Plot2D, while a RadarPlot can contain PieRadarRenderer to draw pie-radars and a RadarRenderer to draw polygons in the polar coordinate system. Different plots also display different types of grids, as listed in GridType and RadarGridType enumerations.
A single instance of a SeriesRenderer -derived class can usually draw data from multiple Series, so you need just one BarRenderer to display bars from several Series. SeriesRenderer-s arrange the elements from several series in appropriate groups. For example, BarRenderer draws elements at same index from multiple Series in side-by-side groups, while BarStackRenderer arranges them in a stack.
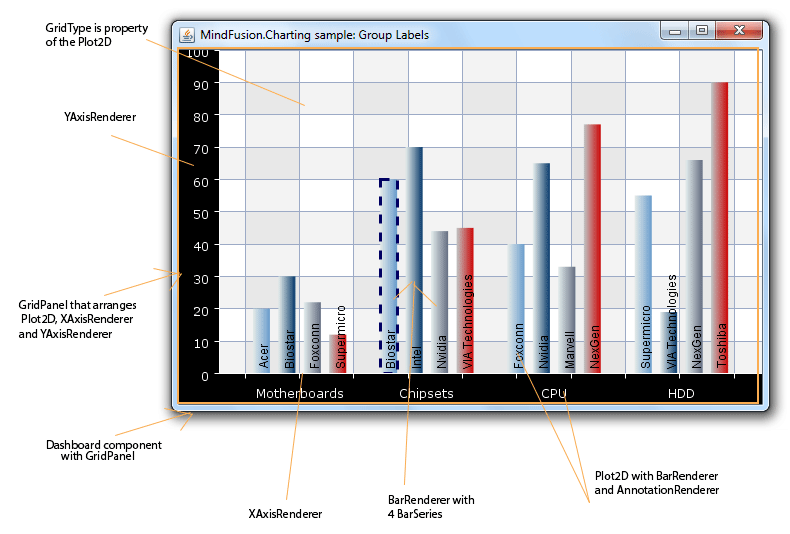
Below is a sample chart that is actually a Dashboard that combines many of the major chart elements: