The appearance settings are organized in a hierarchy. First, there is the separate Theme class that lets you create a theme, save and load it.
Java
 Copy Code Copy Code
|
|---|
BarChart chart = new BarChart();
chart.setTheme(new Theme());
chart.getTheme().setCommonSeriesFills(barFill());
chart.getTheme().setCommonSeriesStrokes(barFill());
chart.getTheme().setLegendBackground(new SolidBrush(Colors.WhiteSmoke));
chart.getTheme().setLegendBorderStroke(new SolidBrush(Colors.Teal));
chart.getTheme().setHighlightStroke(new SolidBrush(Colors.CadetBlue));
.........................
List<Brush> barFill()
{
List<Brush> fills = new ArrayList<Brush>();
fills.add(new SolidBrush(Colors.SkyBlue));
fills.add(new SolidBrush(Colors.Teal));
fills.add(new SolidBrush(Colors.PowderBlue));
return fills;
} |
Normally you would use the Theme editor tool to create a theme and save it. Here is how it looks like: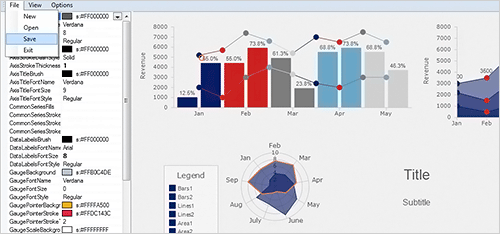
Once you save your Theme you can always load and apply it to the chart:
| Java
Copy Code
|
|---|
Theme theme1 = new Theme();
theme1.loadFrom("C:\\Users\\David_P\\Programs\\Charting.Java\\MFTheme.xml");
chart.setTheme(theme1); |
Values of appearance properties can come from several places in the component hierarchy. SeriesRenderer -derived objects can use attributes from their local SeriesStyle:
| Java
Copy Code
|
|---|
YAxisRenderer barPlotYAxisRenderer = new YAxisRenderer(barPlotYAxis);
barPlotYAxisRenderer.setLabelFontSize(10.0);
barPlotYAxisRenderer.setTitleFontSize(12.0); |
The SeriesStyle can be set from the Plot:
| Java
Copy Code
|
|---|
// series style
candlestickChart.getPlot().setSeriesStyle(
new CandlestickSeriesStyle(
new SolidBrush(Colors.Tomato),
new SolidBrush(Colors.LawnGreen),
new SolidBrush(Colors.Black),
2, DashStyle.Solid,
(CandlestickRenderer)candlestickChart.getPlot().getSeriesRenderers().get(0))); |
Component classes have their local properties:
| Java
Copy Code
|
|---|
radarChart.setBackground(Color.GRAY);
radarChart.setTitleBrush(new SolidBrush(Color.BLUE)); |
They can also use the ones defined in the Theme as shown in the first paragraph.
 Note Note |
|---|
By default, appearance properties in SeriesRenderer and Component classes have null values, which makes the drawing code use values from the Theme. |
The SeriesStyle interface defines how SeriesRenderer objects get appearance attributes for Series elements, where each element of each Series can generally be drawn in distinct style from others. You could implement that interface in your own class to calculate stroke and fill colors dynamically based on Series and element indices. For example, you could paint climbing values in green and falling values in red if drawing financial charts, or calculate a blue-red gradient if drawing temperatures.
Below is a sample CustomSeriesStyle that paints elements in red if they are smaller than 35:
| Java
Copy Code
|
|---|
public class CustomSeriesStyle implements SeriesStyle { private ObservableList<Series> series;
public CustomSeriesStyle(ObservableList<Series> series)
{
this.series = series;
}
@Override
public Brush fill(int seriesIndex, int dataIndex) {
Series serie = series.get(seriesIndex);
double number = serie.getValue(dataIndex, 1);
if( number > 35)
return new SolidBrush(Color.GREEN);
return new SolidBrush(Color.RED);
} @Override
public Brush stroke(int seriesIndex, int dataIndex) {
return new SolidBrush(Color.GRAY);
} @Override
public DashStyle strokeDashStyle(int seriesIndex, int dataIndex) {
// TODO Auto-generated method stub
return null;
} @Override
public Double strokeThickness(int seriesIndex, int dataIndex) {
return 1.5;
} } |
You have two ways to apply it: either on the Plot or on the SeriesRenderer:
| Java
Copy Code
|
|---|
BarChart chart = new BarChart();
chart.getPlot().setSeriesStyle(new CustomSeriesStyle(chart.getSeries())); |
or
| Java
Copy Code
|
|---|
chart.getSeriesRenderer().setSeriesStyle(new CustomSeriesStyle(chart.getSeries())); |
There are several SeriesStyle classes provided out-of-the-box that implement various levels of distinctness for graphical elements drawn for each data item:
- UniformSeriesStyle uses same attributes for all elements of all Series.
- PerSeriesStyle contains different attributes for different Series, where all elements in the series are drawn with same attributes.
- PerElementSeriesStyle allows customization of each element of each Series.
- MixedSeriesStyle allows a mix of uniform, per-element and per-series attributes.
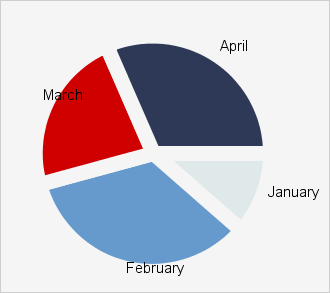
That's how you would apply a PerElementSeriesStyle to a PieChart:
| Java
Copy Code
|
|---|
PieChart chart = new PieChart(); PerElementSeriesStyle style = new PerElementSeriesStyle();
style.setFills(createPieBrushes());
chart.getPlot().setSeriesStyle(style);
//or use the SeriesRenderer
//chart.getSeriesRenderer().setSeriesStyle(style);
.....................
//create the brushes
List<List<Brush>> createPieBrushes()
{
List<Brush> fills = new ArrayList<Brush>();
fills.add(new SolidBrush(new Color(224, 233, 233)));
fills.add(new SolidBrush(new Color(102, 154, 204)));
fills.add(new SolidBrush(new Color(206, 0, 0)));
fills.add(new SolidBrush(new Color(45, 57, 86)));
List<List<Brush>> pieBrushes = new ArrayList<List<Brush>>();
pieBrushes.add(fills);
return pieBrushes;
} |
And that's what you get: