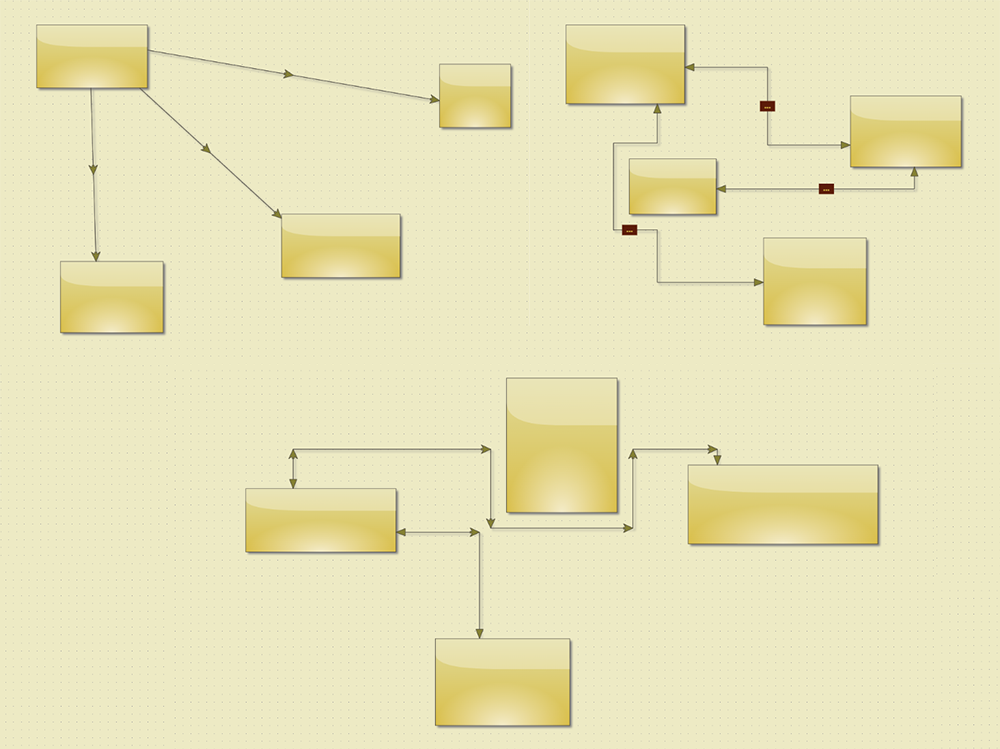
In this blog post we will look at 3 different ways of customizing diagram links. They are:
- Drawing one ShapeNode in the middle of the link.
- Drawing a rectangle in the middle of a link.
- Drawing a ShapeNode at conjunction points.
The following image illustrates DiagramLink s created by each of the three methods.

We will use the Diagram library for JavaScript and develop the application using React.
I. General Setup
We use the create-react-app package to initialize a new React project and call it custom-link-segments:
npx create-react-app custom-link-segments
After that we need to install the Diagram library for JavaScript and the React wrapper. The packages are in scope @mindfusion and we need to use:
npm install @mindfusion/diagramming
npm install @mindfusion/diagramming-react
With that we are ready with the installation and can start coding. We create a new JavaScript file in the src folder and call it DiagrammApp. We will change the default index.js file that is used at application start. We will make it render our DiagramApp class:
import DiagramApp from './DiagramApp'; ReactDOM.render(, document.getElementById('root') );
We import the DiagramApp class and then we replace the App tag that is generated with our DiagramApp component, which we will create now.
In the DiagramApp class we import Component from the React library and the Diagramming and Drawing namespaces from MindFusion’s libraries. We also need the DiagramView component, which is part of the diagramming-rect wrapper. Here are the imports:
import React, { Component } from 'react';
import * as Diagramming from '@mindfusion/diagramming';
import * as Drawing from '@mindfusion/drawing';
import { DiagramView } from '@mindfusion/diagramming-react';
Then we declare the DiagramApp class, it is a React Component. In it, we create an instance of the Diagram class and set its bounds to a Rect object. The bounds specifies the initial size of the diagram. By default, a diagram can auto resize, so no worries if the initial bounds turns to be too small. If you want to change the resize behaviour of the diagram, the property is autoResize.
Here is the initialization code for the diagram and the DiagramApp component:
class DiagramApp extends Component {

   constructor(props) {
      super(props);

      // create the diagram
      var diagram = new Diagramming.Diagram();
      diagram.bounds = new Drawing.Rect(10, 10, 400, 300);
   }
}
In order to see our diagram on the screen, we have to render it in the React render method. We render a diagram through a DiagramView. First, let’s edit the index.css file and add 2 classes, which will position correctly the DiagramView element as we want it:
.container{
  position: absolute;
	display: flex;
  top:10px;
  left:0;
  bottom:10px;
  right:10px;
  left:10px;
  text-align: left;
}

.main{
  flex: 1 1 100%;
  overflow: hidden;
  display: flex;
  position: relative;
}
In order to render a diagram in a DiagramView we need to have access to a Diagram object. We will store the diagram that we created in the constructor in the state, so we can access it in render.
constructor(props) {
.......................

this.state = {
        diagram: diagram
      };
}
In the render method we assign a few properties for the diagram, which will make it look better:
 render() {
        var props = {
          "allowInplaceEdit": true,
          "routeLinks": false,
          "showGrid": true,
          "backBrush": "#edeac4",
        };
}
Then in return we create a new DiagramView and assign its diagram attribute to our diagram instance that we store in the state. We use the spread operator to assign the properties:
render() {
        ....
        return (
            <div className="container">
              <div className="main">
                <DiagramView diagram={this.state.diagram} {...props}/>
              </div>
            </div>

        );
}
Let’s not forget to export the DiagramApp:
export default DiagramApp;
Now we can start our application using the command
npm start
The command must be run from the project folder. If we have done everything well, we will see a blank diagram on our screen.

This is the diagram work area and you can create nodes and connect them. All this functionality is provided out of the box. Now that we have the diagram entirely set up, we can start with the more interesting part: customizing the links. By default the diagram draws plain straight links between nodes.

We will present you with the above-cited 3 different methods to customize the links.
II. Drawing a Rectangle in the Middle of the Link
First we need to handle the linkCreated event. We declare an event handler method onDiagramLinkCreated with parameters as shown below:
onDiagramLinkCreated(sender, args) {

	// add the box
	var label = args.link.addLabel(" ... ");
	label.brush = "#5C1C09";
	// uncomment the below line to 'hide' the dots
	label.textColor = "#D9BE48";
	label.horizontalAlign = Diagramming.Alignment.Center;
	label.verticalAlign = Diagramming.Alignment.Center;

}
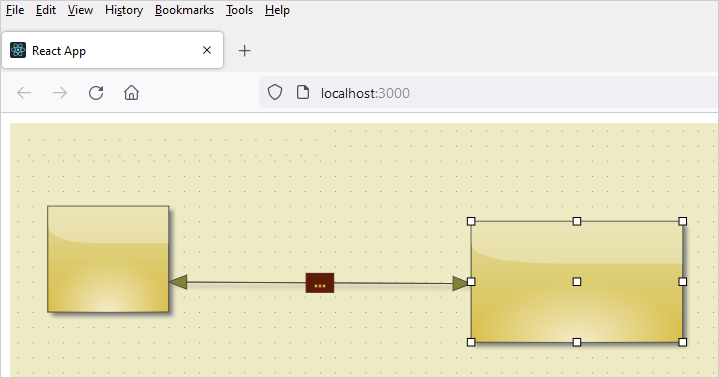
In it we use the —addLabel method to add a text label for the link. The label can have lots of options like brush color, text and alignment – both horizontal and vertical. The link that we use here only renders 3 dots. The text can be completely empty – only the rectangle is used. This is a simpler approach than drawing NodeShape-s, if you need one single rectangle.
We can also change the shape at the beginning and end of the link. This is done through the headShape and https://www.mindfusion.eu/onlinehelp/jsdiagram/index.htm?P_MindFusion_Diagramming_DiagramLink_baseShape_0_1.htm” title=”baseShape property in Js Diagram”>baseShape properties:
// change the arrowhead shape
args.link.headShape = Diagramming.Shape.fromId("Triangle");
args.link.baseShape = Diagramming.Shape.fromId("Triangle");
The id of the shape can be anyone of the predefined diagram shapes. They are demonstrated here.
The result of styling the link with a label and triangular head and base shape is shown below:

That’s the simplest approach to have a shape in the middle of a link. If you want to have a more fancy shape, however, you need to draw a real shape. ANd this is our second scenario.
III. Drawing a NodeShape in the Middle of the Link.
We will handle the onUpdateVisuals event to add a shapeRenderer to the graphicsContainer of a link. This is advanced technique and we will explain it step by step.
First we get the link object from the event args and assign a new function to its onUpdateVisuals event:
onDiagramLinkCreated(sender, args) {

        args.link.onUpdateVisuals = function (link){
	};

}
Then we create a new shape from a component and get its renderer:
var linkShape = Diagramming.Shape.component("BowArrow", false);

var headRenderer = linkShape.shapeRenderer;
We get the startPoint and endPoint of the link with the respective properties. Then we calculate the middle point:
 var sp = link.startPoint;
var ep = link.endPoint;

var middle = new Drawing.Point((sp.x + ep.x)/2, (sp.y + ep.y)/2 );

if(link.points.length > 2)
   middle = link.points[1];
Now we can use the shapreRenderer to update the arrow data:
headRenderer.updateArrowHeadData(link.headShapeBounds,
            middle, link.startPoint);

headRenderer.strokeThickness = link.effectiveHeadStrokeThickness;
headRenderer.outlineBrush = link.effectiveHeadBrush;
headRenderer.outlinePen = link.effectiveHeadStroke
headRenderer.decorationPen = link.effectiveHeadStroke;
headRenderer.strokeDashStyle = link.effectiveHeadStrokeDashStyle;

link.graphicsContainer.content.push(headRenderer);
The shapreRenderer can be used to customize the brushes and strokes for the shape. It is important to remember to add the renderer to the content of the graphicsContainer for this link.
If we draw links now, they will render a BowArrow shape in the middle. If the link has multiple segments as with “routeLinks” turned on, the BowArrow will be rendered on the first conjunction point.

IV. Drawing NodeShape-s at Segment Points
If we want to draw a NodeShape at every segment point of a rooted arrow, we will have to put the code from the method described in III in a cycle. We won’t calculate the middle point of the link, we will add a shapreRenderer for a shape at each link point.
args.link.onUpdateVisuals = function (link){

            for(var i =1; i <link.points.length-1; i++)
            {
                var linkShape = Diagramming.Shape.component("BowArrow", false);

                var headRenderer = linkShape.shapeRenderer;

                var current = link.points[i];
                var prev = link.points[i-1];

                headRenderer.updateArrowHeadData(link.headShapeBounds,
                current, prev);
                .......................
        	.......................
                link.graphicsContainer.content.push(headRenderer);
	     }
}
The points property gives us all the points of a link. We cycle through them and add a Shape on each one, excluding the two final points. The second point in the updateArrowHeadData method is responsible for setting the direction. Now if we draw a link, it will have a shape on each of its points:

And with that our tutorial is finished. You can download the full source code of the sample from the following link:
Custom Node Shapes on Diagram Links in React: Download Sample
Technical support is available through MindFusion forum here.
About Diagramming for JavaScript: This native JavaScript library provides developers with the ability to create and customize any type of diagram, decision tree, flowchart, class hierarchy, graph, genealogy tree, BPMN diagrams and much more. The control offers rich event set, numerous customization options, animations, graph operations, styling and themes. You have more than 100 predefined nodes, table nodes and more than 15 automatic layout algorithms. Learn more about Diagramming for JavaScript at https://mindfusion.eu/javascript-diagram.html.
