WinForms.Spreadsheet: Sorting Data

In this blog we will discuss how to sort existing data in MindFusion.Spreadsheet for WinForms both programmatically and by using the built-in form.

Introduction

As with all previous blogs we start off by creating a new Windows Forms Application in Visual Studio and adding a WorkbookView control to the main form. The WorkbookView displays a Workbook with a single worksheet.

Initializing the data

The data that should be sorted is contained in an CSV (comma-separated value) file, which is loaded at the start of the application. Some minor formatting is applied to the imported data, such as emphasizing the header row. The columns are automatically resized to fit the content through the ResizeColumnsToFit method of the WorkbookView class.

Sorting programmatically

The sorting is performed by calling the Sort method of the Worksheet class and providing a SortOptions object. This object contains information about the sort, such as which row or column to sort by, the sort direction (horizontal or vertical) and so on. In this particular case, we sort the data by columns, therefore we specify TopToBottom for the sort direction:

sortOptions.Direction = SortDirection.TopToBottom;

The columns (or rows) to sort by are specified by SortKey objects, added to the Keys collection of the SortOptions class. The order of the keys in the collection is important. For example, to sort by the first column and then by the fourth column, we define the following keys:

sortOptions.Keys.Add(new SortKey(0));
sortOptions.Keys.Add(new SortKey(3));

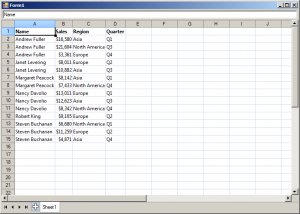
The Sort method accepts as argument the range to be sorted. In this sample we would like to prevent the header row from being sorted and specify A2:D15 for the target range.

The following image shows the running sample:

spreadsheet-sorting

Sorting through the built-in form

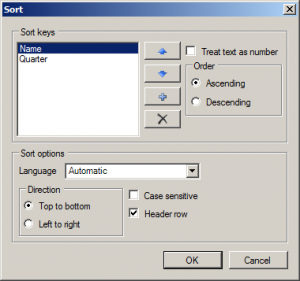
Sorting can also be performed through the built-in SortForm form, contained in the MindFusion.Spreadsheet.WinForms.StandardForms.dll assembly. The image below displays the form with the first and fourth columns selected as sort keys:

spreadsheet-sortform

The source code is available for download from here:

https://mindfusion.eu/_samples/SpreadsheetSorting.zip

The trial version of MindFusion.Spreadsheet for WinForms can be downloaded from here:

Download MindFusion.Spreadsheet for WinForms Trial Version

About MindFusion.Spreadsheet for WinForms: A powerful .NET spreadsheet component with great capabilities for editing, styling and formatting large amounts of data.

WinForms.Spreadsheet: Apply Conditional Formatting

In this blog we will discuss how to apply conditional formatting to a range of cells in MindFusion.Spreadsheet for WinForms. Conditional formatting is a feature that allows you to apply different formatting options, such as background color, borders, or font to cells that meet certain criteria and have this formatting automatically change depending on the value or formula of the cell.

Introduction

We start off by creating a new Windows Forms Application in Visual Studio and adding a WorkbookView control to the main form. The WorkbookView displays a Workbook with a single worksheet.

Initializing the data

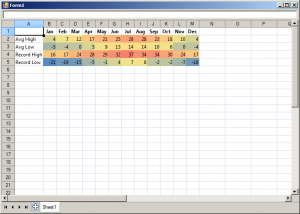
The goal of the application is to display an array of temperature values, colored differently based on a standard temperature scale. The data of the application is hard-coded in several arrays, which are used to initialize the worksheet:

var names = new CultureInfo("en-US").DateTimeFormat.AbbreviatedMonthNames;
var avgHigh = new int[] { 4, 7, 12, 17, 21, 25, 28, 28, 23, 18, 10, 4 };
var avgLow = new int[] { -5, -4, 0, 5, 9, 13, 14, 14, 10, 6, 0, -4 };
var recordHigh = new int[] { 16, 17, 24, 28, 29, 32, 37, 34, 34, 30, 24, 17 };
var recordLow = new int[] { -21, -19, -15, -5, -1, 4, 7, 8, -2, -2, -7, -16 };

Applying the conditional formatting

In MindFusion.Spreadsheet conditional formatting is applied to a range of cells through its style. This is done by calling the Style.ConditionalFormats.Add method to create IConditionalFormat objects and then setting the properties of the newly created object to specify the condition criteria and the style to apply when the criteria are met. In this application we use a simple algorithm to distribute temperature values linearly along a blue-yellow-red color scale. When a cell value falls within a specific temperature interval, the conditional formatting applies a background color to this cell to visually indicate the value.

The following image shows the running sample:

spreadsheet-conditionalformats

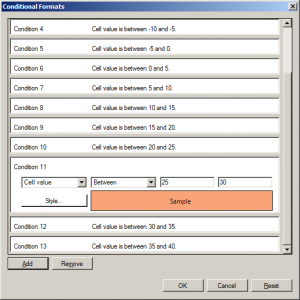
Conditional formatting can also be created and modified through the built-in ConditionalFormatForm form, contained in the MindFusion.Spreadsheet.WinForms.StandardForms.dll assembly. The image below displays the form for the temperature cell range.

spreadsheet-conditionalformatform

The source code is available for download from here:

https://mindfusion.eu/_samples/SpreadsheetConditionalFormats.zip

The trial version of MindFusion.Spreadsheet for WinForms can be downloaded from here:

Download MindFusion.Spreadsheet for WinForms Trial Version

About MindFusion.Spreadsheet for WinForms: A powerful .NET spreadsheet component with great capabilities for editing, styling and formatting large amounts of data.
WinForms Spreadsheet Databinding

In this blog we will discuss how to display the information from a database inside MindFusion.Spreadsheet for WinForms, how to validate and edit the data and how to write back any changes.

Introduction

We start off by creating a new Windows Forms Application in Visual Studio, adding a WorkbookView control to the main form and adding the Northwind database (nwind.mdb) as a data source. For simplicity we only add the Categories table. After compiling the application we can add the DataSource and the CategoriesTableAdapter as components to the main form.

Loading the data

We traverse the rows in the data source and populate the spreadsheet by assigning the data to the Data property of the respective worksheet cells. To prevent certain columns from being edited (for example auto-increment keys and image fields), we mark these columns by setting their Tag property. All columns and rows beyond those that actually display data are hidden by setting their IsHidden property to true. The column titles are set to the names of the corresponding database columns. Finally, the columns are resized to fit their contents through the ResizeColumnsToFit method of the view. The complete code of the data loading can be found in the LoadData method.

Note, that during the data loading, the loading flag is set to true. This is done to prevent some unnecessary operations in the CellChanging and CellChanged event handlers.

Setting up the view

To resemble a data grid, we need to disable certain functions in the view. More specifically, we need to hide the tabs, the formula bar, the auto-fill handle and the hidden header indicator.

workbookView1.ShowHiddenHeaderIndicators = false;
workbookView1.AllowAutoFill = false;
workbookView1.ShowTabs = false;
workbookView1.ShowFormulaBar = false;

Performing validation

We want to prevent the users from changing the values of certain cells – for example, the cells in the auto-increment column and the cells representing pictures. To do this, we will handle the InplaceEditStarting event of the WorkbookView and the WorksheetCellChanging event of the Workbook. In the event handlers we check the Tag value of the related column. If the column is marked as read-only, we set the Cancel property of the event argument to true, to prevent the edit or change.

Adding new rows

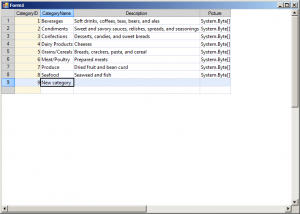
When we populated the data from the dataset, we left an empty row at the bottom of the spreadsheet. The intent is that this empty row should be used to add new rows to the table. When the user edits a cell of the empty row, the row key is automatically calculated and a new empty row is added at the bottom of the spreadsheet. To implement this functionality, we handle the WorksheetCellChanged event of the Workbook. In the event handler, we inspect the row of the edited cell. If this is the last visible row in the spreadsheet, we calculate a key for this row and reveal another row at the bottom of the spreadsheet by setting its IsHidden property to false.

Saving changes to the database

Changes are immediately reflected back to the database from within the WorksheetCellChanged event handler. New rows are added via the Rows.Add method of the Categories data table. Existing rows are updated directly through the respective DataRow object. The changes are effectively performed by calling the Update method of the table adapter.

The following image shows the running sample:

spreadsheet-databinding

The source code is available for download from here:

https://mindfusion.eu/_samples/SpreadsheetDatabase.zip

The trial version of MindFusion.Spreadsheet for WinForms can be downloaded from here:

Download MindFusion.Spreadsheet for WinForms Trial Version

About MindFusion.Spreadsheet for WinForms: A powerful .net spreadsheet component with great capabilities for editing, styling and formatting large amounts of data.