Chart components render data values from Series objects assigned to chart's Series collection. In this tutorial we'll show how to create several series representing stock prices, and render them as side-by-side bars in a BarChart. The tutorial assumes you have added a BarChart instance as described in Getting Started guide. The complete example project is available under Samples subfolder of library's distribution.
1. Let's start by creating a method that returns (pretend) stock price data. If you have access to a stock market service, you could as well replace this code with a call to the service API as documented by its provider. The StockPrice class returned by this method is defined in the com.mindfusion.charting package for use with some kinds of charts, but any plain data object will work for this example:
Java
 Copy Code Copy Code
|
|---|
static CompletableFuture<List<StockPrice>> fetchStockPrices(String name)
{
// pretend we are calling a web service, returning
// stock price statistics for last 7 days
return CompletableFuture.supplyAsync(() ->
{
var random = new Random();
Instant date = Instant.now().minus(8, ChronoUnit.DAYS);
var prices = new ArrayList<StockPrice>();
for (int i = 0; i < 7; i++)
{
date = date.plus(1, ChronoUnit.DAYS);
double open = 200 + 500 * random.nextDouble();
double close = open + 50 * (0.5 - random.nextDouble());
double low = Math.min(open, close) - 50 * random.nextDouble();
double high = Math.max(open, close) + 50 * random.nextDouble();
prices.add(
new StockPrice(open, close, low, high, Date.from(date)));
}
return prices;
});
} |
2. Call the fetchStockPrices method from createChart method:
| Java
Copy Code
|
|---|
Chart createChart()
{
BarChart chart = new BarChart();
fetchStockPrices("ACME").thenAcceptAsync(
(stockPrices) ->
{
....
},
new SwingExecutor());
return chart;
} |
3. Add a mapList helper method we'll use to extract the value of specific property from the StockPrice lists:
| Java
Copy Code
|
|---|
static <R, T> List<R> mapList(List<T> list, Function<T, R> mapper)
{
return list.stream().map(mapper).collect(Collectors.toList());
} |
4. Now we'll extract values of the StockPrice object properties and fill SimpleSeries instances with the double values. Each SimpleSeries is drawn as a sequence of bars, by default interlacing the bars to draw side-by-side groups for each index. Other options for grouping bars from multiple series are provided by the BarLayout property. Each bar can also display labels inside or on top of the bar, or at the X axis. Here we'll show axis label for only one of the series. The series' Title property is displayed inside chart's legend box. Add the following code to the then-accept block:
| Java
Copy Code
|
|---|
// a series of daily opening prices
SimpleSeries openSeries = new SimpleSeries(
mapList(stockPrices, sp -> sp.getOpen()),
mapList(stockPrices, sp -> new DateTime(sp.getDate()).toShortDateString()));
openSeries.setTitle("Open");
openSeries.setSupportedLabels(
EnumSet.of(LabelKinds.XAxisLabel));
chart.getSeries().add(openSeries);
// a series of daily closing prices
SimpleSeries closeSeries = new SimpleSeries(
mapList(stockPrices, sp -> sp.getClose()),
null /* no additional string labels*/);
closeSeries.setTitle("Close");
chart.getSeries().add(closeSeries);
// a series of daily min prices
SimpleSeries minSeries = new SimpleSeries(
mapList(stockPrices, sp -> sp.getLow()),
null /* no additional string labels*/);
minSeries.setTitle("Low");
chart.getSeries().add(minSeries);
// a series of daily max prices
SimpleSeries maxSeries = new SimpleSeries(
mapList(stockPrices, sp -> sp.getHigh()),
null /* no additional string labels*/);
maxSeries.setTitle("Low");
chart.getSeries().add(maxSeries); |
5. Set the color of each series by modifying the chart's Theme:
| Java
Copy Code
|
|---|
// assign different colors to each series
chart.getTheme().setCommonSeriesFills(
Colors.Yellow, Colors.LightBlue, Colors.Red, Colors.Green); |
6. Finally, set a few properties to customize chart caption labels and axis appearance:
| Java
Copy Code
|
|---|
// customize axis appearance
chart.setTitle("ACME stock price weekly");
chart.getYAxis().setMinValue(0.0);
chart.getYAxis().setTitle("stock price in USD");
chart.getXAxis().setTitle("");
chart.setShowXCoordinates(false);
chart.setShowXTicks(false);
chart.setLegendHorizontalAlignment(LayoutAlignment.Far); |
7. In case your IDE does not add imports automatically, here's the import code from the complete sample project:
| Java
Copy Code
|
|---|
import java.awt.*;
import java.time.Instant;
import java.time.temporal.ChronoUnit;
import java.util.ArrayList;
import java.util.Date;
import java.util.EnumSet;
import java.util.List;
import java.util.Random;
import java.util.concurrent.CompletableFuture;
import java.util.function.Function;
import java.util.stream.Collectors;
import javax.swing.*;
import com.mindfusion.drawing.*;
import com.mindfusion.charting.*;
import com.mindfusion.charting.components.LayoutAlignment;
import com.mindfusion.charting.swing.*;
import com.mindfusion.common.DateTime;
import com.mindfusion.common.SwingExecutor; |
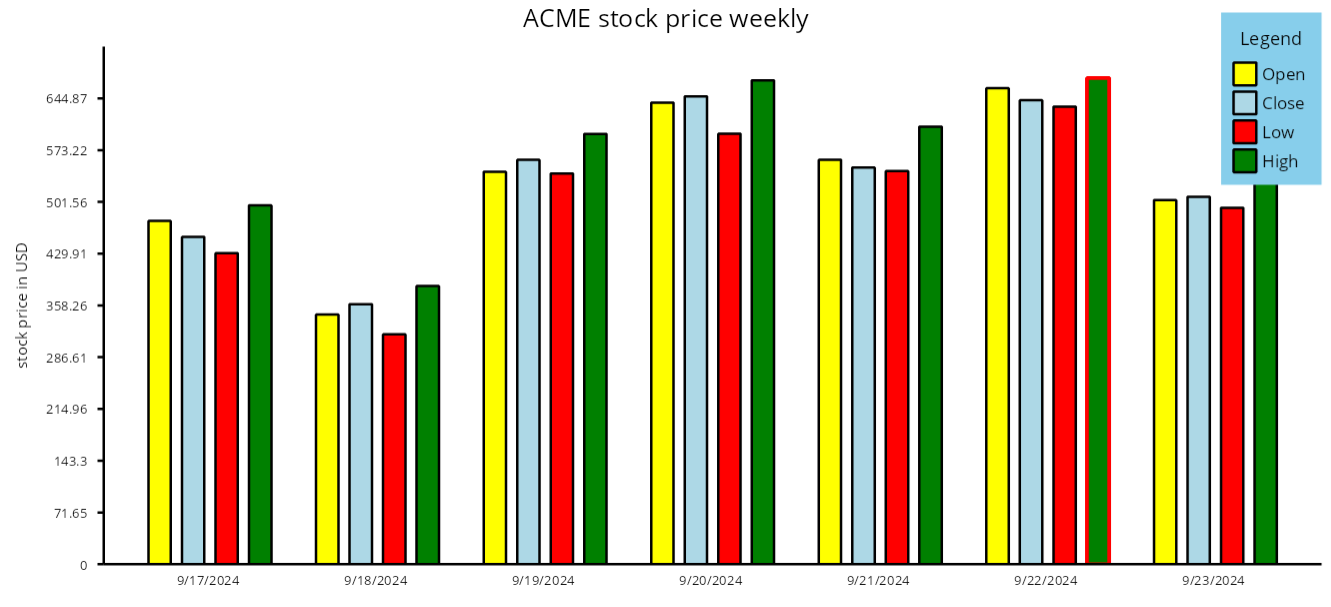
8. If you run the project now, it should render a chart like this: