Tutorial 3: Mixed Chart Graphics
This tutorial shows how to draw different types of chart graphics inside same Plot. Each Chart -derived component from the library is a Dashboard specialization that adds a single SeriesRenderer to the plot, e.g. BarChart adds a BarRenderer to its Plot by default. You can create additional renderers from different types and add them to a chart as in this example, or build a dashboard with multiple plots and renderers as demonstrated in next tutorial. The following sample code builds upon Tutorial 2, moving two of the Series to a LineRenderer.
1. Remove the low and high series and color assignments from previous tutorial code, leaving only open and close prices:
Java
 Copy Code Copy Code
|
|---|
// a series of daily opening prices |
2. Create a LineRenderer for the low and high prices:
| Java
Copy Code
|
|---|
// display min and max prices as a line chart |
3. Set appearance attributes for the lines by setting renderer's SeriesStyle property. The Fills list here is only set for the legend items:
| Java
Copy Code
|
|---|
PerSeriesStyle minMaxStyle = new PerSeriesStyle(); |
4. Add the new renderer to both chart's Plot and to the legend box:
| Java
Copy Code
|
|---|
chart.getPlot().getSeriesRenderers().add(minMaxRenderer); |
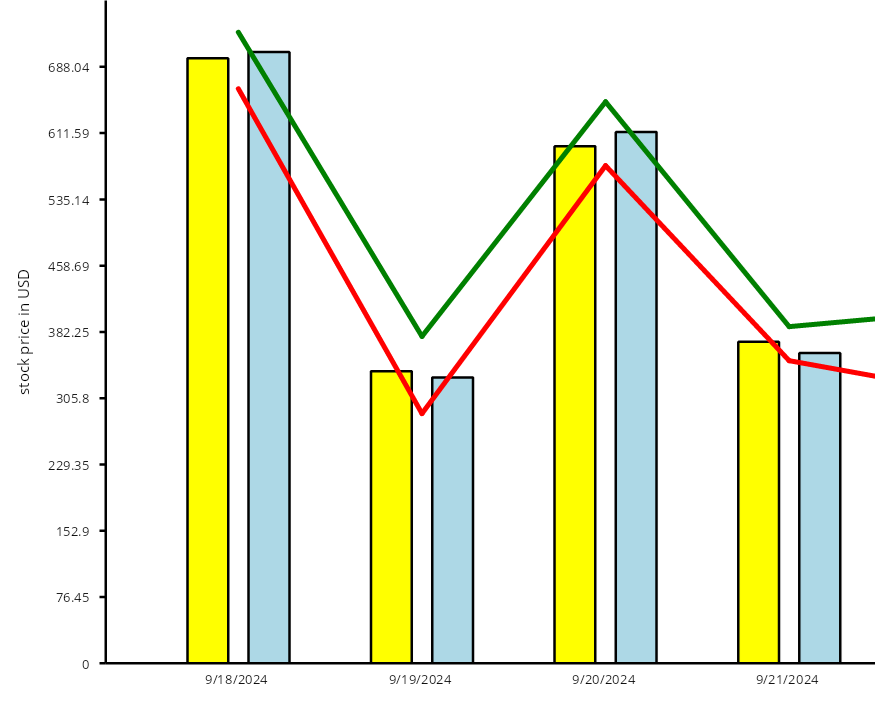
5. Running the example now should show line graphics on top of the bars: