MindFusion JavaSript Diagram Library has a new version. Here is an overview of the new features:
Free-form nodes
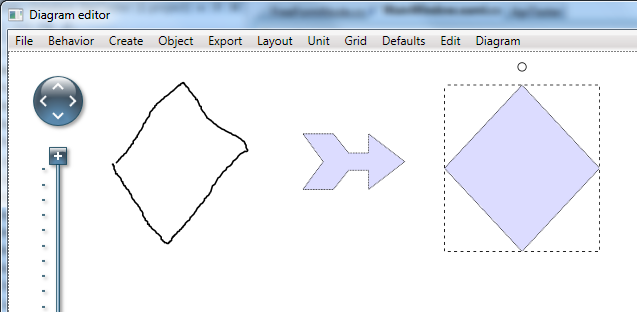
The new version lets you use a special, new type of nodes called FreeFormNode. In this case the control collects all points from users’ mouse or touch input and displays them as node’s outline. In order to allow users to draw free-form nodes interactively, set Behavior to DrawFreeForms or LinkFreeForms. The Points property of FreeFormNode allows you to get or set outline points programmatically. If the Closed property is set, the node is drawn as a closed shape and its interior filled, or otherwise the node is drawn as a poly-line.

FreeFormNodes allow the user to draw diagram shapes with the mouse or the finger
Convert free-form drawings to ShapeNodes
This release introduces additional drawing modes, convenient for touch input. They convert FreeFormNode objects drawn by the user to ShapeNode objects with matching shapes. To enable them, set Behavior to DrawFreeShapes or LinkFreeShapes. The shapes against which the user’s input is matched are set via diagram’s FreeFormTargets property. By default it contains Rectangle, Decision and Ellipse shapes.
Miscellaneous
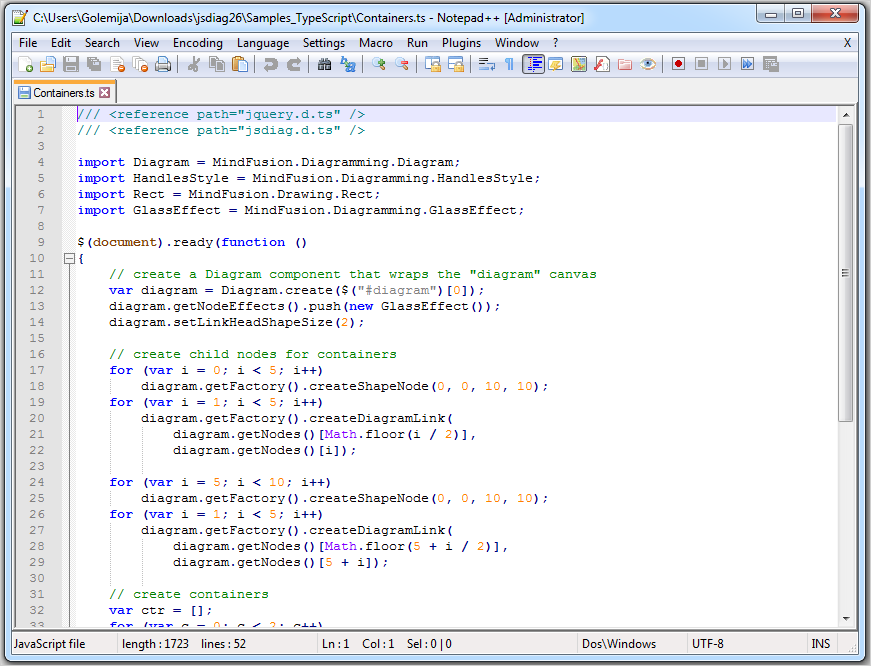
- TypeScript definitions for the Diagramming API are now provided in jsdiag.d.ts file.
- nodePasted and linkPasted events are now raised when new DiagramNode and DiagramLink instances are created from clipboard contents.
- VirtualScroll mode fixed for parent div size specified in percent units.
- Removed several global variables created inadvertently by the control.
A trial version is available for download here:
Download MindFusion Diagram Library for JavaScript, V2.6
About Diagramming for JavaScript Library: Written 100% in JavaScript, this tool is a dynamic, browser based visualization library that uses HTML5 Canvas to draw impressive diagrams, schemes, flowcharts, trees and many more. It is browser independent, easy to use and allows you to integrate interactive diagrams for JavaScript and HTML into any web application. This MindFusion graphing library supports a variety of predefined node shapes, customizable links, rich event set and many appearance options.
The user interaction model includes resizing / moving / selecting and modifying any diagram element. The library boasts an elegant API, which is documented in details, numerous step-by-step guides and tutorials. The Diagramming API also provides TypeScript definitions. Various samples are provided to let you learn quickly how to use the most important features of the library – check them here. The JavaScript diagram builder is not only the perfect choice for creating any type of diagram in the browser – it can also arrange it the way you wish with a mouse click using one of its automatic graph layout algorithms. For more details about the features of the component, please visit the Diagram for JavaScript page.


