
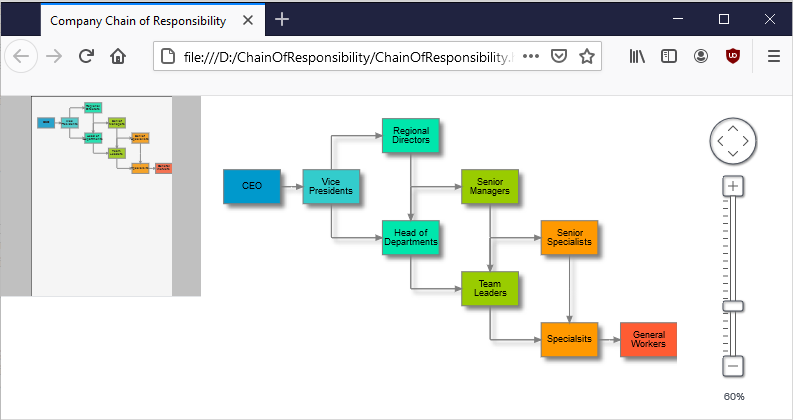
We will build a diagram where we will arrange the nodes in a hierarchical manner to visualize the chain of responsibility in a company. We use the JavaScript Diagramming library, the TreeLayout and custom AnchorPattern definitions for nodes. Here is the final result:
I. General Setup
We use a web page to host the diagram and we create an empy JavaScript code-behind file. The web page needs to reference the *.js files that represent the flowchart library:
<script src="MindFusion.Common.js" type="text/javascript"></script>
<script src="MindFusion.Diagramming.js" type="text/javascript"></script>
<script src="ChainOfResponsibility.js" type="text/javascript"></script>
Then we need a Canvas for the diagram, to render itself onto. It is important that we give the Canvas an id. This way we can reference it from the code-behind file:
 <div style="position: absolute; top: 0px; bottom: 0px; right: 0px; width: 200px;
				height: 200px; border-bottom: 1px solid #e2e4e7; background-color: #c0c0c0;">
                <canvas id="overview" width="200" height="200">
                </canvas>
            </div>
Now we are ready to start coding our application.
II. The Diagram and Diagram Nodes
We create the diagram using the HTML element that represents the diagram canvas:
// create a Diagram component that wraps the "diagram" canvas
diagram = Diagram.create(document.getElementById("diagram"));
diagram.setVirtualScroll(true);
The setVirtualScroll method makes the canvas stay as large as its containing
Each node will hold text and will be rendered in a special color depending on its location in the tree. Here are the two lists that contain the text and colors for the nodes:
//list with brushes for the nodes
var brushes = ["#0099cc",  "#33cccc", "#00e6ac", "#00e6ac", "#99cc00", "#99cc00", "#ff9900",  "#ff9900", "#ff5c33"];
//list with company positions
var positions = ["CEO", "Vice Presidents", "Regional Directors", "Head of Departments", "Senior Managers", "Team Leaders", "Senior Specialists", "Specialists", "General Workers"];
We use an instance of the Factory class, which is a helper class with static methods for creating DiagramNode and DiagramLink instances.
var f = diagram.getFactory();
for (var i = 0; i < 9; i++)
{
	var node = f.createShapeNode(0, 0, 25, 15);
	node.setText(positions[i]);
	node.setBrush({ type: 'SolidBrush', color: brushes[i] });
	node.setStroke('#7F7F7F');
}
The stroke for each node is light gray. The brush and text are taken from the corresponding arrays, which we declared earlier. Note that when you create diagram items with the Factory class, they get added automatically to the collection of items of the Diagram If you create them manually, you will have to add them by yourself.
III. Diagram Links
We create DiagramLink instances between the nodes that we want to be connected through the createDiagramLink method. The method returns the instance of the newly created link.
var link = f.createDiagramLink(n[0], n[1]);
We use it to style the link with a special method: styleLink.
//we make the links look pretty
function styleLink(link)
{
	link.setStroke("#7F7F7F");
	link.setStrokeThickness(1.0);
	link.setHeadShape("Triangle");
	link.setHeadShapeSize(3.0);
	link.setHeadBrush({ type: 'SolidBrush', color: '#7F7F7F' });
}
We style each link, once it is created by calling the method:
styleLink(link);
The method uses the –setStroke and setHeadBrush methods to specify gray stroke and brush for links. It also sets a triangular head shape for the link with the size of 3.
Then we use the AnchorPattern class to create two patters on anchoring to nodes. The anchors are docking points on nodes for incoming or outgoing links – depends on how you crate them. The AnchorPattern is built from AnchorPoint instances. Each AnchorPoint represents a docking point and the other two boolean parameters in the constructor specify if the pattern should be applied to incoming and outgoing nodes. The AnchorPoint -s define the docking points relatively to a rectangle with measurements (0, 0, 100, 100) for top, left, bottom, right. This means that a point in the middle of the left border is (0, 50) and a point in the middle of the bottom border is (50, 100).
Here is the code of the two AnchorPattern -s that we will use:
var ap1 = new AnchorPattern([
	new AnchorPoint(50, 0, true, true),
	new AnchorPoint(100, 50, true, true),
	new AnchorPoint(50, 100, true, true),
	new AnchorPoint(0, 50, true, true)
]);

	var ap2 = new AnchorPattern([
	new AnchorPoint(50, 0, true, true),
	new AnchorPoint(50, 100, true, true),
	new AnchorPoint(0, 50, true, true)
]);
We use the setAnchorPattern method to apply one of the two patters we’ve defined to the nodes. It depends on the count of outgoing links:
for (var i = 0; i < 9; i++)
{
	if (n[i].getOutgoingLinks().length > 1)
		n[i].setAnchorPattern(ap2);
	else
		n[i].setAnchorPattern(ap1);
}
IV. Diagram Layout
Once the nodes are created we use the TreeLayout to arrange them beautifully. Initially we create all nodes with the same coordinates, so it is the algorithm that places them away from each other:
var layout = new MindFusion.Graphs.TreeLayout();
layout.direction = 1; //LayoutDirection.LeftToRight
layout.nodeDistance = 30;
layout.anchoring = Anchoring.Reassign;
diagram.arrange(layout);
All layout algorithms are applied with the arrange method, that is called on the diagram instance. It takes the desired algorithm as a parameter. If we only apply the algorithm the result looks like this:
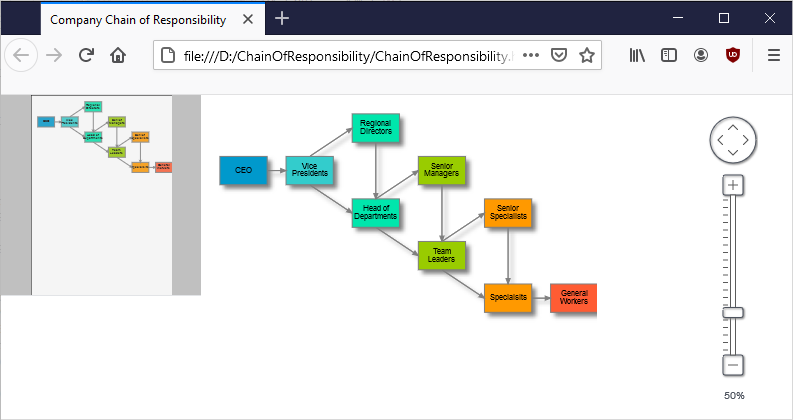
In order to see the arrows well arranged we can call the routeAllLinks method. After it is called, the links look much better.
And that is the end of this tutorial. You can download the complete source code together with all libraries used from this link:
Chain Of Responsibility Diagram: Download Full Code
Technical support is available through MindFusion forum here.
About Diagramming for JavaScript: This native JavaScript library provides developers with the ability to create and customize any type of diagram, decision tree, flowchart, class hierarchy, graph, genealogy tree, BPMN diagrams and much more. The control offers rich event set, numerous customization options, animations, graph operations, styling and themes. You have more than 100 predefined nodes, table nodes and more than 15 automatic layout algorithms. Learn more about Diagramming for JavaScript at https://mindfusion.eu/javascript-diagram.html.