The new version of Diagramming for JavaScript library is out! Here is an overview of the new features:
Appearance improvements
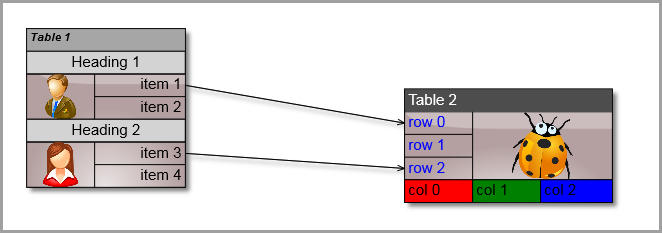
- You can now set the Shape property of tables and containers to RoundedRectangle and render them with rounded corners.
- It is possible to hide the frames of table cells by setting the CellFrameStyle property to None.
- You can now set the EnableStyledText property of TableNode class to render styled text in tables.
New events
- The control raises cellTextEdited event when users edit the text of table cells.
- The createEditControl event lets you create custom DOM element or fragment to use as in-place text editor.
- NodeListView raises nodeSelected event when the user selects a node.
Miscellaneous
- jQuery mode is now the default and all sample projects have been updated to use jQuery. To continue using the Microsoft Ajax library, set MindFusionImpl = “MsAjax” before loading Diagramming.js
- the loadFromXml method of Diagram class lets you load XML files created by MindFusion diagram controls for other platforms.
- fixed setZoomFactorPivot bug in virtual scroll mode.
Registered customers with an active upgrade subscription can download the licensed version from the clients area on our site.
A trial version is available for direct download from the following link:
Download MindFusion Diagramming Library for JavaScript, V2.4
We are glad to receive any comments, suggestions and feedback. You can write us at e-mail support@mindfusion.eu or use the help desk. You can use the JsDiagram section on MindFusion forum to post questions about the tool.
About Diagramming for JavaScript Library: Written 100% in JavaScript, this tool uses HTML5 Canvas to draw impressive diagrams, schemes, flowcharts, trees and many more. It is browser independent, easy to use and integrate into any web application. JsDiagram supports a variety of predefined node shapes, customizable links, rich event set and many appearance options.
The user interaction model includes resizing / moving / selecting and modifying any diagram element. The tool boasts an elegant API, which is documented in details as well numerous step-by-step guides and tutorials. Various samples are provided to let you learn quickly how to use the most important features of the library – check them here. JsDiagram is not only the perfect choice for creating any type of diagram in the browser – it can also arrange it the way you wish with a mouse click using one of its automatic graph layout algorithms. For more details about the features of the component, please visit the Diagram for JavaScript page.

