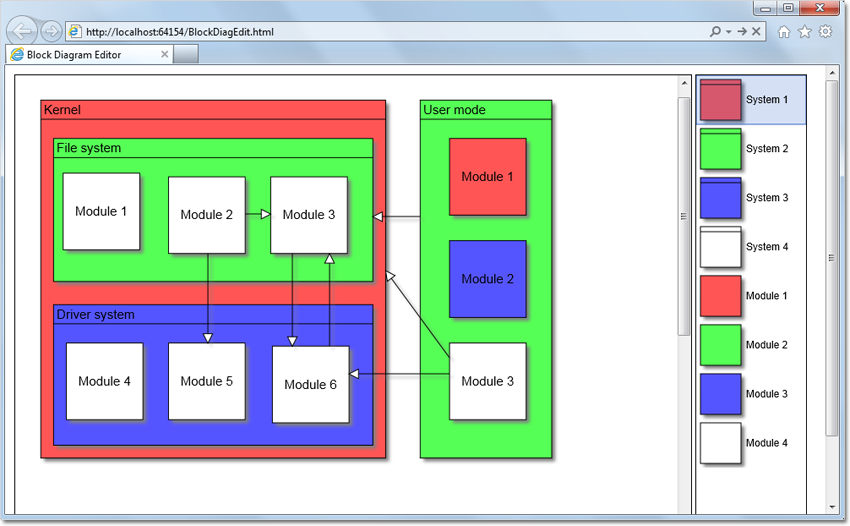
In this example, we will create a block diagram editor using MindFusion.Diagramming for JavaScript.
First, let’s add two HTML canvas elements to a page, one for the Diagram control and one for a NodeListView control that will serve as a tool palette:
<!-- The Diagram component is bound to the canvas element below -->

<div style="width:800px; height:600px; overflow:auto; border: 1px solid;">
  <canvas id="diagram" width="2100" height="2100">
    This page requires a browser that supports HTML 5 Canvas element.
  </canvas>
</div>


<!-- NodeListView control -->

<div style="width:130px; height:600px; overflow:none; border: 1px solid rgb(0, 0, 0);">
  <canvas id="nodeList" width="130" height="600"></canvas>
</div>
Next, add references to the necessary script files:
<script src="MicrosoftAjax.js" type="text/javascript"></script>
<script src="MindFusion.Diagramming.js" type="text/javascript"></script>
<script src="BlockDiagEdit.js" type="text/javascript"></script>
In the load handler in the script file, setup the diagram properties and populate the node list with prototype containers and shape nodes, that will represent respectively systems and modules in our block diagrams:
Sys.Application.add_load(function (sender, args)
{
	// create a Diagram component that wraps the "diagram" canvas
	diagram = $create(Diagram, null, null, null, $get("diagram"));
	diagram.addEventListener(Events.nodeCreated, onNodeCreated);
	diagram.addEventListener(Events.linkCreated, onLinkCreated);
	diagram.setLinkHeadShapeSize(3);
	diagram.setLinkHeadShape("Alternative");
	diagram.setAllowInplaceEdit(true);

	// create a NodeListView component that wraps the "nodeList" canvas
	var nodeList = $create(MindFusion.Diagramming.NodeListView,
        null, null, null, $get("nodeList"));
	nodeList.setIconSize(new Size(48, 48));
	nodeList.setDefaultNodeSize(new Size(24, 24));

	var colors = [
		"#FF5555",
		"#55FF55",
		"#5555FF",
		"#FFFFFF"
	];

	// add container to the NodeListView to represent "system" blocks
	for (var i = 0; i < 4; ++i)
	{
		var node = new ContainerNode(diagram);
		node.setBrush(colors[i]);
		nodeList.addNode(node, "System " + (i + 1));
	}

	// add container to the NodeListView to represent "module" blocks
	for (var i = 0; i < 4; ++i)
	{
		var node = new MindFusion.Diagramming.ShapeNode(diagram);
		node.setShape("Rectangle");
		node.setBrush(colors[i]);
		nodeList.addNode(node, "Module " + (i + 1));
	}
});
Handle the nodeCreated event to make containers larger, and start inplace edit operation to let users enter text immediately after dropping a node:
function onNodeCreated(sender, args)
{
	var node = args.getNode();
	if (ContainerNode.isInstanceOfType(node))
	{
		// make containers larger
		var bounds = node.getBounds().clone();
		bounds.width = 100;
		bounds.height = 75;
		node.setBounds(bounds);
	}

	// let user enter text immediately
	diagram.beginEdit(node);
}
When there aren’t anchor points defined, the diagram control snaps link points to nearest point of nodes borders. Let’s automatically align points when links are created to make them straight horizontal or vertical lines if they are already close to being such. Otherwise leave points unchanged to let users draw diagonal lines too:
function onLinkCreated(sender, args)
{
	var link = args.getLink();
	var start = link.getStartPoint();
	var end = link.getEndPoint();

	// make link horizontal if close to being one
	if (Math.abs(start.x - end.x) > 10 && Math.abs(start.y - end.y) < 4)
	{
		end.y = start.y;
		link.setEndPoint(end);
	}

	// make link vertical if close to being one
	if (Math.abs(start.y - end.y) > 10 && Math.abs(start.x - end.x) < 4)
	{
		end.x = start.x;
		link.setEndPoint(end);
	}
}
Here’s the kind of block diagrams and flowcharts you can now draw:

The complete example can be downloaded from this link:
https://mindfusion.eu/_samples/BlockDiagEdit.zip
Enjoy!
