
MindFusion is pleased to announce a new release of Charting for WPF programming component. Here is an overview of the new features:
Real-time Chart
The RealTimeChart control is optimized to render animated line chart graphics of large amounts of data. That’s implemented by moving already rendered elements from the WPF visual tree to a cache bitmap, relying that new data is added incrementally rather than changing coordinates of old data points. The library also offers various customization options for the chart – scatters, multiple legends, multiple Y and Y2 axes, custom labels, tooltips, grid.
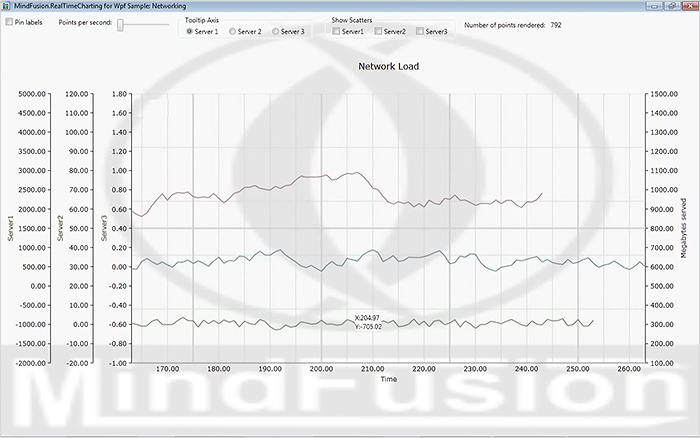
The real time chart.
3D Charts
- All 3D charts now support unlimited number of series.
- New property Lights holds a collection of Light objects instead of the LightType property.
- Detailed hit testing, which returns a ChartHitTestResult3D that contains the clicked 3D point, the normalized 3D point, a collection of chart elements (if found), and the nearest peak (in surface charts).
- AllowMeshSelection property, which when enabled allows selection of mesh objects with a mouse click.
- The MeshSelectionBrush sets the brush for the selection.
- Behavior3D property, which lets you choose how the chart responds to mouse interactions.
- Improved performance for all chart types.
Surface Charts
- SurfaceType property, which sets whether scatters or surface is drawn.
- SurfaceSeries.GroundLevelMargin property, which sets the GroundLevel-offset.
- Each Series3D can be clipped in a given range with the ClipMinimum and ClipMaximum properties.
- TextureType property sets the texture of the chart – Brush or ColorMap.
- New ColorMapList property, which sets a Color map with arbitrary colors and offsets.
- CloseModelFigure property, which closes the sides of the model if enabled.
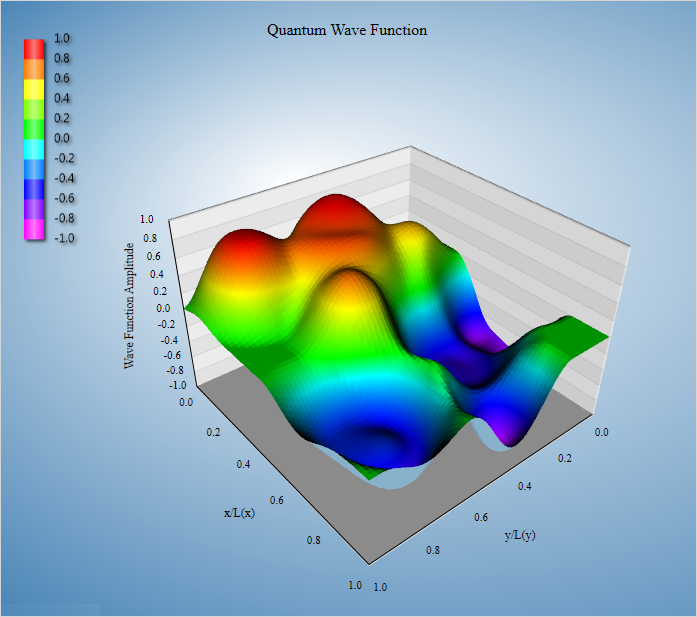
A surface chart
Miscellaneous
- ShowCrossHair renders a cross hair that will trace the mouse position over the plot area.
- Enable the LineSeries.Curve property to draws lines as canonical splines.
You can read further details about the release and the other new features at the news section in the Charting forum. A trial version is available for download from here:
Download MindFusion.Charting for WPF 1.9 Trial Version
You are welcome to contact us with any questions, problems or inquiries about the Charting for Wpf control or any other of our products. MindFusion has always put special emphasis on providing excellent customer support and we usually answer your inquiries in a few hours of receiving them.
About MindFusion.Charting for Wpf: A programming component that combines powerful charting capabilities with an elegant API and easy use. Among the features of the control are fully customizable grid, positive and negative values on all chart axes, 3D charts, gauges and many more – read a detailed list here.
The control provides detailed documentation and various samples that demonstrate how to customize every type of chart. It supports a wide range of 2D and 3D charts including bar, line, radar, bubble pie etc. You can add tooltips, define themes, perform hit testing, zoom and more.