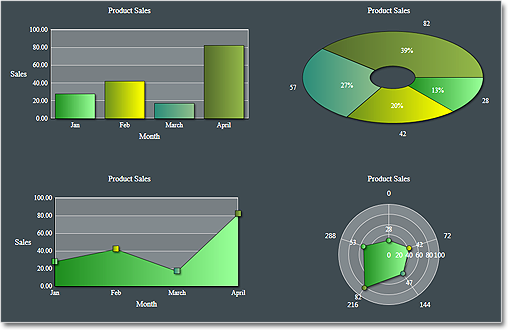
MindFusion has released a new version of its Charting component for Wpf with the following new features:
Styles and Themes
Styles define the appearance of individual chart elements such as the axis, the series and the legend. Each ChartTheme contains a collection of styles and defines the appearance of the whole chart. The new version lets you:
- create themes based on the appearance of an existing chart;
- create themes with the ThemeEditor tool;
- save themes to XML files;
- load themes from XML files;
- use a number of predefined themes.
The “Working with Themes” tutorial gives detailed information on how to create, save, load and edit themes with MindFusion.Charting for WPF.
Improved Design Time Support
You can now edit all collection properties, including the Series collection, the brushes and strokes in design time through the property grid.
Axis Intervals
The new AxisSettings.IntervalCount property lets you specify the exact number of intervals at the axis. In such case, the control does not use the Interval property and calculates the value of each interval based on AxisSettings.Min, AxisSettings.Max and AxisSettings.IntervalCount properties.
You can read further details about the release and the other new features at the news section in the Charting forum. A trial version is available for download from here:
Download MindFusion.Charting for WPF 1.8 Trial Version
You are welcome to contact us with any questions, problems or inquiries about the Charting for Wpf control or any other of our products. MindFusion has always put special emphasis on providing excellent customer support and we usually answer your inquiries in a few hours of receiving them.
About MindFusion.Charting for Wpf: A programming component that combines powerful charting capabilities with an elegant API and easy use. Among the features of the control are fully customizable grid, positive and negative values on all chart axes, 3D charts, gauges and many more – read a detailed list here.
The control provides detailed documentation and various samples that demonstrate how to customize every type of chart. It supports a wide range of 2D and 3D charts including bar, line, radar, bubble pie etc. You can add tooltips, define themes, perform hit testing, zoom and more.

