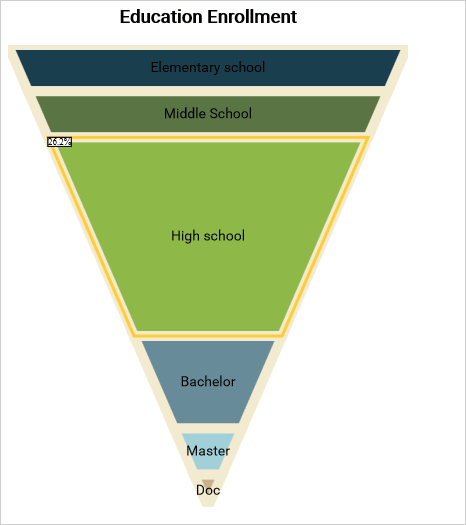
In this blog post we will create a funnel chart that demonstrates education enrollment. We will use the JavaScript chart library.
I. Chart Setup.
The Charting library requires a few JavaScript files, which we copy in a folder named Scripts. The files are:
- config.js
- MindFusion.Charting.js
- MindFusion.Common.js
- MindFusion.Gauges.js
- require.js
Those files are redistributed with the chart library. If you plan to use different directory structure in your project you must edit the config.js file.
Now we create two files – an HTML page FunnelChart.html and a funnelchart.js file, which will contain the code for the chart. In the FunnelChart.html file we add two references:
<script type="text/javascript" src="Scripts/config.js"></script>
<script data-main="funnelchart" src="Scripts/require.js"></script>
One to the config file and the other to the require.js file. Note that the data-main attribute points exactly to the name of the javascript code-behind file that we’ll use to create and customize the chart.
II. Create the Chart
The chart needs a canvas and we add one to the web page:
<canvas id="funnelChart" width="400" height="500"></canvas>
The size determines the size of the chart, the id is important because we’ll use it to access the canvas from code.
The code for each JavaScript chart is in a single method:
define(["require", "exports", 'MindFusion.Charting'], function (require, exports, m) {
    "use strict";
    var Charting = m.MindFusion.Charting;
    var Controls = m.MindFusion.Charting.Controls;
    var Collections = m.MindFusion.Charting.Collections;
    var Drawing = m.MindFusion.Charting.Drawing;

    //create the chart
    var funnelChartEl = document.getElementById('funnelChart');

    var funnelChart = new Controls.FunnelChart(funnelChartEl);

     .......
     //chart customization
     .......
     .......
     funnelChart.draw();
});
The chart object is created with the help of the FunnelChart canvas element, which we get from the html page using the id.
III. Data
Data for the funnel chart is a single list with values. That is why we use the SimpleSeries class. It takes two arguments – one list with the data and one with the labels. We initialize the two arrays:
//initialize data and labels
var data = new Collections.List([100, 90, 80, 37, 17, 7]);
var labels = new Collections.List(["Elementary school", "Middle School", "High school", "Bachelor", "Master", "Doc"]);
Then we create the series and assign it to the series property of the funnelChart object.
//assign a series
funnelChart.series = new Charting.SimpleSeries(data, labels);
IV. Appearance Customization
We don’t need a legend for the chart that is why we set:
funnelChart.showLegend = false;
A chart needs a title and we set one:
funnelChart.title = "Education Enrollment";
MindFusion JavaScript chart library has a flexible styling model, which allows us to customize the pens and brushes of a chart either directly through the theme property or through styles. A combination of both is possible and that’s what we’ll use. First, we will use the PerElementSeriesStyle for coloring the chart element. This style uses each of the Brush-es that were added to it to paint just one element from the chart. If necessary, the control cycles through the provided Brush -es.
var brushes = new Collections.List([
	new Drawing.Brush("#193e4e"),
        new Drawing.Brush("#5a7444"),
        new Drawing.Brush("#8eb848"),
        new Drawing.Brush("#678b99"),
        new Drawing.Brush("#a1d0d8"),
        new Drawing.Brush("#c5b28a"),

	]);

	var seriesBrushes = new Collections.List();
	seriesBrushes.add(brushes);
The PerElementSeriesStyle expects a nested list with Brushes – because a chart can have many series with many elements into it. The same is true for the strokes, but we will add just one Brush, because we want all elements to have one common outlinig:
var strokes = new Collections.List([
	new Drawing.Brush("#f2ebcf"),
        ]);

var seriesStrokes = new Collections.List();
seriesStrokes.add(strokes);
We repeat the process for StrokeThickness-es and then we create the style object:
funnelChart.plot.seriesStyle = new Charting.PerElementSeriesStyle(seriesBrushes, seriesStrokes, serieStrokeThicknesses);
The theme property exposes many fields that help us customize our chart. We adjust the font and change the highlight stroke, which renders when a chart element is selected:
funnelChart.theme.titleFontSize = 18;
funnelChart.theme.titleFontName = "Roboto";
funnelChart.theme.titleFontStyle = Drawing.FontStyle.Bold;

funnelChart.theme.dataLabelsFontName = "Roboto";
funnelChart.theme.dataLabelsFontSize = 14;

funnelChart.theme.highlightStroke = new Drawing.Brush("#ffcc33");
V. Tooltips
We want our chart to render tooltips. The SimpleSeries does not include tooltips by default and we must do some code twisting to make it show them. First, we create a field tooltips, that is assigned to a list with the desired tooltips:
var tooltips = new Collections.List(["32.7%", "29.5%", "26.2%", "12%", "5%", "2%"]);
funnelChart.series.tooltips = tooltips;
Then we have to override the supportedLabels property of the Series class to make it return LabelKinds.ToolTip in addition to LabelKinds.InnerLabel.
Object.defineProperty(m.MindFusion.Charting.SimpleSeries.prototype, "supportedLabels", {
            get: function () { return m.MindFusion.Charting.LabelKinds.InnerLabel | m.MindFusion.Charting.LabelKinds.ToolTip; },
            enumerable: true,
            configurable: true
 });
Finally, we must return the appropriate tooltip and the appropriate label, when asked. This is done by overriding the getLabel method of the SimpleSeries class.
m.MindFusion.Charting.SimpleSeries.prototype.getLabel = function (index, kind) {
	if ((kind & m.MindFusion.Charting.LabelKinds.ToolTip) != 0 && this.tooltips)
		return this.tooltips.items()[index];

	if (this.labels == null)
		return null;
	return this.labels.items()[index];
};
With that the work on our funnel chart is done and we can enjoy the result:
Complete source code including the libraries is available for direct download from the link below:
Download the Funnel Chart Sample
About MindFusion JavaScript Chart Library: MindFusion JS Chart is an interactive library for charts and gauges written purely in JavaScript. It supports all common chart types, multiple series, custom data,financial charts, funnel charts, a large selection of gauges and rich styling capabilities. The elegant architecture of the library allows you to create dashboards, charts with multiple different types of series in a single plot, unlimited number of axes, reusable styling themes, various oval and linear gauges. The innovative approach to data lets you define your own data classes by implementing a single interface.
The library also boasts a rich event set, zoom, pan, dragging of the legend and a set of many popular gauges. It is designed and implemented to provide JS developers with the perfect tool to create beautiful, interactive dashboards fast and easy. Download trial directly at http://mindfusion.eu/JavaScript.Chart.zip Get your license today at http://www.javascript-chart-buy.html

